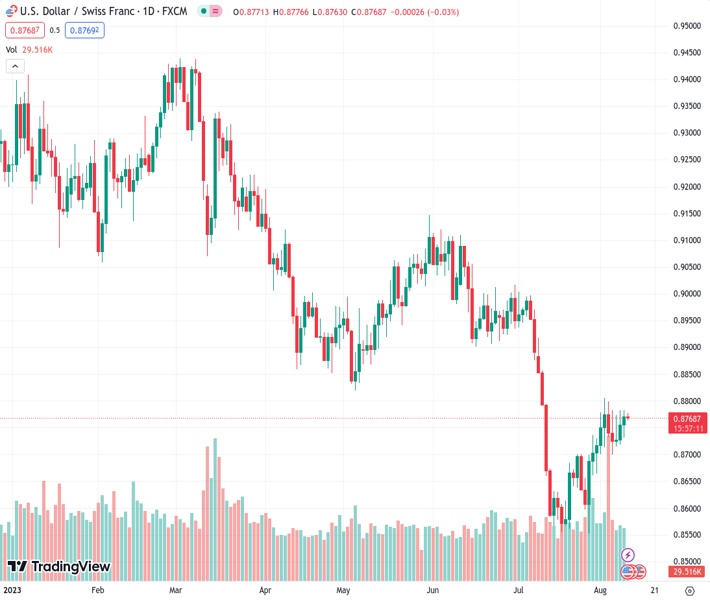
The USDCHF pair, currently trading at 0.87695, is fluctuating near its weekly high as market activity remains subdued ahead of the release of the Consumer Price Index (CPI) data. The pair has recorded its first daily decline in four days.
…
This is a premium post.
[s2If !current_user_can(access_s2member_level4)]Please register for FREE REGISTER to read full post below containing analysis. In case of any error or you think you are not able to read the full post below, please email us at support#nehcap.com [lwa][/s2If] [s2If current_user_can(access_s2member_level1)]
- USD/CHF seesaws around weekly top amid pre-CPI inaction, prints the first daily loss in four.
The pair currently trades last at 0.87695.
The previous day high was 0.8783 while the previous day low was 0.8732. The daily 38.2% Fib levels comes at 0.8763, expected to provide support. Similarly, the daily 61.8% fib level is at 0.8751, expected to provide support.
USD/CHF bears lack momentum as the Swiss Franc (CHF) pair fails to extend the first daily loss in four near 0.8665-70 heading into Thursday’s European session. That said, the quote’s latest pullback can be linked to the US Dollar’s retreat ahead of the all-important inflation data, as well as a shift in the market’s sentiment despite the risk-negative headlines surrounding China.
That said, US Dollar Index (DXY) remains depressed near 102.45 after snapping a two-day uptrend the previous day. In doing so, the Greenback’s gauge versus the six major currencies justifies the market’s cautious mood ahead of the US inflation data, as well as a light calendar.
It’s worth noting that the mildly bid S&P500 Futures and the Treasury bond yields suggest the market’s cautious optimism despite headlines suggesting trade wars between the US and China, as well as looming concerns of Sino-UK geopolitical tension.
Recently, Financial Times (FT) came out with the news suggesting that UK Prime Minister Rishi Sunak is weighing whether to follow US President Joe Biden in restricting outbound investment into the Chinese tech sector, including artificial intelligence, chips and quantum computing. Before that, US President Joe Biden signed the much-awaited bill that allows the US Treasury Department to prohibit or restrict certain US investments in Chinese entities, per Reuters.
China’s Commerce Ministry showed grave concerns and marked the right to take measures against the US ban on technology investment. However, such an issue was long discussed and the announced steps are slightly lenient than originally planned, which in turn allowed the markets to remain cautiously optimistic.
On a broader scale, hopes of witnessing an end to hawkish monetary policy in the US, mainly due to the recently downbeat US employment data and downbeat early signals for today’s Consumer Price Index (CPI) for July, seem to underpin the USD/CHF fall. That said, the US CPI is expected to improve to 3.3% YoY versus 3.0% prior and an upbeat outcome can defy concerns that the Fed is near its peak rate, which in turn may recall the pair buyers.
Also read: US CPI Preview: Forecasts from 10 major banks, monthly pace should hold at 0.2%
Unless providing a daily closing below the two-week-long horizontal support around 0.8700, the USD/CHF bulls stay on the way to challenge a downward-sloping resistance line from November 2022, close to 0.8825 by the press time.
Technical Levels: Supports and Resistances
USDCHF currently trading at 0.8765 at the time of writing. Pair opened at 0.8772 and is trading with a change of -0.08% % .
| Overview | Overview.1 | |
|---|---|---|
| 0 | Today last price | 0.8765 |
| 1 | Today Daily Change | -0.0007 |
| 2 | Today Daily Change % | -0.08% |
| 3 | Today daily open | 0.8772 |
The pair is trading above its 20 Daily moving average @ 0.868, below its 50 Daily moving average @ 0.8854 , below its 100 Daily moving average @ 0.893 and below its 200 Daily moving average @ 0.9136
| Trends | Trends.1 | |
|---|---|---|
| 0 | Daily SMA20 | 0.8680 |
| 1 | Daily SMA50 | 0.8854 |
| 2 | Daily SMA100 | 0.8930 |
| 3 | Daily SMA200 | 0.9136 |
The previous day high was 0.8783 while the previous day low was 0.8732. The daily 38.2% Fib levels comes at 0.8763, expected to provide support. Similarly, the daily 61.8% fib level is at 0.8751, expected to provide support.
Note the levels of interest below:
- Pivot support is noted at 0.8742, 0.8711, 0.8691
- Pivot resistance is noted at 0.8793, 0.8813, 0.8844
| Levels | Levels.1 |
|---|---|
| Previous Daily High | 0.8783 |
| Previous Daily Low | 0.8732 |
| Previous Weekly High | 0.8806 |
| Previous Weekly Low | 0.8665 |
| Previous Monthly High | 0.9005 |
| Previous Monthly Low | 0.8552 |
| Daily Fibonacci 38.2% | 0.8763 |
| Daily Fibonacci 61.8% | 0.8751 |
| Daily Pivot Point S1 | 0.8742 |
| Daily Pivot Point S2 | 0.8711 |
| Daily Pivot Point S3 | 0.8691 |
| Daily Pivot Point R1 | 0.8793 |
| Daily Pivot Point R2 | 0.8813 |
| Daily Pivot Point R3 | 0.8844 |
[/s2If]
Download Nehcap EAWe have two EAs that are operational on our LIVE accounts.
- EA-FIX: Check out the details here. Download EA-FIX . EA-FIX is a non-grid HFT scalper.
- EA-GROWTH: High quality low dd EA using trend grids. Download EA_GROWTHJoin Our Telegram Group
")


