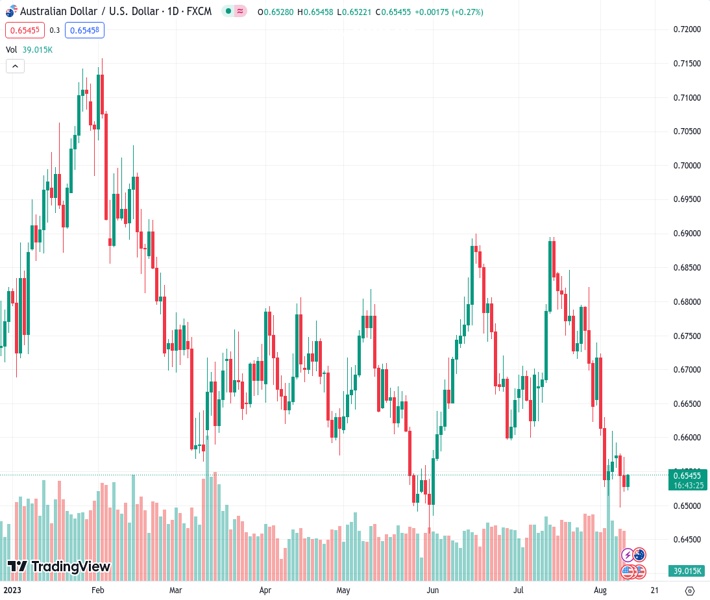
The AUDUSD currency pair, trading at 0.65434, sees a slight increase in momentum on Thursday, although there is a lack of sustained upward movement.
…
This is a premium post.
[s2If !current_user_can(access_s2member_level4)]Please register for FREE REGISTER to read full post below containing analysis. In case of any error or you think you are not able to read the full post below, please email us at support#nehcap.com [lwa][/s2If] [s2If current_user_can(access_s2member_level1)]
- AUD/USD regains some positive traction on Thursday, albeit lacks follow-through.
The pair currently trades last at 0.65434.
The previous day high was 0.6571 while the previous day low was 0.652. The daily 38.2% Fib levels comes at 0.654, expected to provide support. Similarly, the daily 61.8% fib level is at 0.6552, expected to provide resistance.
The AUD/USD pair attracts fresh buying during the Asian session on Thursday and for now, seems to have snapped a two-day losing streak. Spot prices currently trade around the 0.6540 region, up over 0.20% for the day, though remain well within the striking distance of the lowest level since early June touched on Tuesday.
Hopes for additional stimulus measures from China turn out to be a key factor benefiting antipodean currencies, including the Australian Dollar (AUD). The US Dollar (USD), on the other hand, struggles to gain any meaningful traction as traders seem reluctant to place aggressive bets ahead of the crucial US consumer inflation figures, due later today. This, in turn, acts as a tailwind for the AUD/USD pair and remains supportive of the intraday uptick.
That said, concerns about the worsening economic conditions in China, fueled by the incoming weaker macro data, might keep a lid on the China-proxy Aussie. It is worth recalling that Chinese inflation figures released on Wednesday showed that consumer prices declined for the first time since February 2021, while the Producer Price Index (PPI) fell for the 10th consecutive month in July. This was seen as another sign that domestic demand is weakening.
Apart from this, weaker Chinese trade data on Tuesday raised questions about the pace of post-pandemic recovery in the world’s second-largest economy. Furthermore, expectations that the Federal Reserve (Fed) will stick to its hawkish stance and keep interest rates higher for longer should act as a tailwind for the USD, which might contribute to capping the AUD/USD pair. This warrants caution before positioning for any further appreciating move.
Hence, the focus will remain glued to the US CPI report, which might offer fresh cues about the Fed’s future rate hike path. The outlook, in turn, will play a key role in influencing the USD price dynamics and help determine the next leg of a directional move for the AUD/USD pair. Meanwhile, the recent slide below the 0.6600 mark confirmed a bearish double-top breakdown and suggests that the path of least resistance for spot prices is to the downside.
Technical Levels: Supports and Resistances
AUDUSD currently trading at 0.6539 at the time of writing. Pair opened at 0.6528 and is trading with a change of 0.17 % .
| Overview | Overview.1 | |
|---|---|---|
| 0 | Today last price | 0.6539 |
| 1 | Today Daily Change | 0.0011 |
| 2 | Today Daily Change % | 0.1700 |
| 3 | Today daily open | 0.6528 |
The pair remains strongly bearish on the daily time frame. It trades below the 20 SMA @ 0.6696, 50 SMA 0.6703, 100 SMA @ 0.6685 and 200 SMA @ 0.6736.
| Trends | Trends.1 | |
|---|---|---|
| 0 | Daily SMA20 | 0.6696 |
| 1 | Daily SMA50 | 0.6703 |
| 2 | Daily SMA100 | 0.6685 |
| 3 | Daily SMA200 | 0.6736 |
The previous day high was 0.6571 while the previous day low was 0.652. The daily 38.2% Fib levels comes at 0.654, expected to provide support. Similarly, the daily 61.8% fib level is at 0.6552, expected to provide resistance.
Note the levels of interest below:
- Pivot support is noted at 0.6508, 0.6488, 0.6457
- Pivot resistance is noted at 0.656, 0.6591, 0.6611
| Levels | Levels.1 |
|---|---|
| Previous Daily High | 0.6571 |
| Previous Daily Low | 0.6520 |
| Previous Weekly High | 0.6740 |
| Previous Weekly Low | 0.6514 |
| Previous Monthly High | 0.6895 |
| Previous Monthly Low | 0.6599 |
| Daily Fibonacci 38.2% | 0.6540 |
| Daily Fibonacci 61.8% | 0.6552 |
| Daily Pivot Point S1 | 0.6508 |
| Daily Pivot Point S2 | 0.6488 |
| Daily Pivot Point S3 | 0.6457 |
| Daily Pivot Point R1 | 0.6560 |
| Daily Pivot Point R2 | 0.6591 |
| Daily Pivot Point R3 | 0.6611 |
[/s2If]
Download Nehcap EAWe have two EAs that are operational on our LIVE accounts.
- EA-FIX: Check out the details here. Download EA-FIX . EA-FIX is a non-grid HFT scalper.
- EA-GROWTH: High quality low dd EA using trend grids. Download EA_GROWTHJoin Our Telegram Group
")


