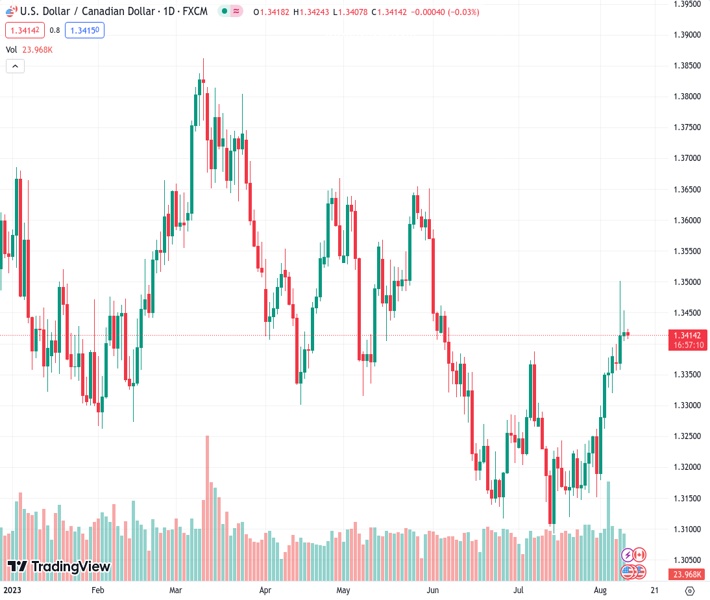
On Thursday, the USDCAD exchange rate of 1.34147 shows a lack of clear direction and continues to trade within a small range.
…
This is a premium post.
[s2If !current_user_can(access_s2member_level4)]Please register for FREE REGISTER to read full post below containing analysis. In case of any error or you think you are not able to read the full post below, please email us at support#nehcap.com [lwa][/s2If] [s2If current_user_can(access_s2member_level1)]
- USD/CAD lacks any firm intraday direction on Thursday and remains confined in a narrow range.
The pair currently trades last at 1.34147.
The previous day high was 1.3454 while the previous day low was 1.3404. The daily 38.2% Fib levels comes at 1.3435, expected to provide resistance. Similarly, the daily 61.8% fib level is at 1.3423, expected to provide resistance.
The USD/CAD pair struggles to gain any meaningful traction on Thursday and oscillates in a narrow trading band, above the 1.3400 round-figure mark through the Asian session. The technical setup, meanwhile, seems tilted in favour of bullish traders and warrants some caution before positioning for an extension of the corrective decline from the 1.3500 psychological mark, or over a two-month high touched on Tuesday.
Crude Oil prices consolidate the previous day’s rise to a fresh YTD peak, which underpins the commodity-linked Loonie and acts as a headwind for the USD/CAD pair. That said, expectations that the Bank of Canada (BoC) will pause its rate hike campaign cap gains for the Canadian Dollar (CAD). The US Dollar (USD), on the other hand, continues to draw support from the prospects for further policy tightening by the Federal Reserve (Fed) and contribute to limiting the downside for the major.
From a technical perspective, this week’s sustained breakout through the 1.3390-1.3400 confluence hurdle – comprising the 50% Fibonacci retracement level of the May-July downfall and the 100-day Simple Moving Average (SMA) – was seen as a fresh trigger for bullish traders. Moreover, oscillators on the daily chart are holding in the positive territory and are still far from being in the overbought zone. This, in turn, suggests that the path of least resistance for the USD/CAD pair is to the upside.
That said, repeated failures to find acceptance above the 61.8% Fibo. level warrants some caution and makes it prudent to wait for some follow-through buying beyond the mid-1.3400s before placing fresh bullish bets. The USD/CAD pair might then make a fresh attempt to conquer the 1.3500 mark and accelerate the momentum further towards testing the next relevant hurdle near the 1.3555-1.3560 region. The subsequent move-up could lift spot prices further towards the 1.3600 round figure.
On the flip side, any meaningful slide below the 1.3400-1.3390 confluence resistance breakpoint, now turned support, might attract some buyers near the weekly low, around the 1.3355 region. This should help limit the downside for the USD/CAD pair near the 1.3315-1.3310 zone, or the 38.2% Fibo. level. This is closely followed by the 1.3300 mark, which if broken might prompt some technical selling and drag spot prices to the 1.3250 support en route to the 23.6% Fibo. level, around the 1.3225 region.
A convincing break below the latter, leading to a subsequent fall below the 1.3200 mark, will negate the positive outlook and shift the near-term bias back in favour of bearish traders. The USD/CAD pair might then accelerate the slide towards the 1.3160-1.3150 intermediate support before eventually dropping to test sub-1.3100 levels, or the YTD low touched on July 14.
Technical Levels: Supports and Resistances
USDCAD currently trading at 1.3415 at the time of writing. Pair opened at 1.3419 and is trading with a change of -0.03 % .
| Overview | Overview.1 | |
|---|---|---|
| 0 | Today last price | 1.3415 |
| 1 | Today Daily Change | -0.0004 |
| 2 | Today Daily Change % | -0.0300 |
| 3 | Today daily open | 1.3419 |
The pair is trading above its 20 Daily moving average @ 1.3252, above its 50 Daily moving average @ 1.3268 , above its 100 Daily moving average @ 1.3393 and below its 200 Daily moving average @ 1.3452
| Trends | Trends.1 | |
|---|---|---|
| 0 | Daily SMA20 | 1.3252 |
| 1 | Daily SMA50 | 1.3268 |
| 2 | Daily SMA100 | 1.3393 |
| 3 | Daily SMA200 | 1.3452 |
The previous day high was 1.3454 while the previous day low was 1.3404. The daily 38.2% Fib levels comes at 1.3435, expected to provide resistance. Similarly, the daily 61.8% fib level is at 1.3423, expected to provide resistance.
Note the levels of interest below:
- Pivot support is noted at 1.3397, 1.3376, 1.3347
- Pivot resistance is noted at 1.3447, 1.3476, 1.3497
| Levels | Levels.1 |
|---|---|
| Previous Daily High | 1.3454 |
| Previous Daily Low | 1.3404 |
| Previous Weekly High | 1.3394 |
| Previous Weekly Low | 1.3151 |
| Previous Monthly High | 1.3387 |
| Previous Monthly Low | 1.3093 |
| Daily Fibonacci 38.2% | 1.3435 |
| Daily Fibonacci 61.8% | 1.3423 |
| Daily Pivot Point S1 | 1.3397 |
| Daily Pivot Point S2 | 1.3376 |
| Daily Pivot Point S3 | 1.3347 |
| Daily Pivot Point R1 | 1.3447 |
| Daily Pivot Point R2 | 1.3476 |
| Daily Pivot Point R3 | 1.3497 |
[/s2If]
Download Nehcap EAWe have two EAs that are operational on our LIVE accounts.
- EA-FIX: Check out the details here. Download EA-FIX . EA-FIX is a non-grid HFT scalper.
- EA-GROWTH: High quality low dd EA using trend grids. Download EA_GROWTHJoin Our Telegram Group
")


