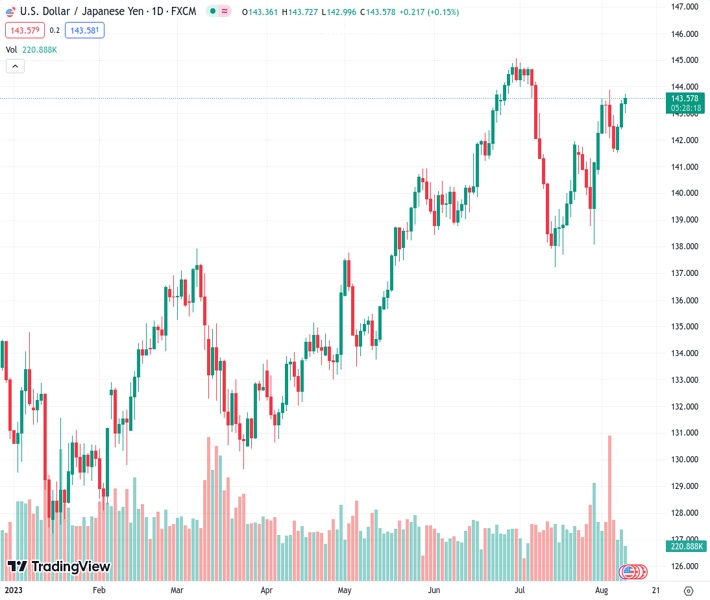
The USDJPY pair increases to 143.53, despite a weakening US Dollar in relation to other foreign currencies and a decrease in US Treasury bond yields.
…
This is a premium post.
[s2If !current_user_can(access_s2member_level4)]Please register for FREE REGISTER to read full post below containing analysis. In case of any error or you think you are not able to read the full post below, please email us at support#nehcap.com [lwa][/s2If] [s2If current_user_can(access_s2member_level1)]
- USD/JPY climbs to 143.53 despite weakening US Dollar across FX and declining US Treasury bond yields.
The pair currently trades last at 143.565.
The previous day high was 143.5 while the previous day low was 142.4. The daily 38.2% Fib levels comes at 143.08, expected to provide support. Similarly, the daily 61.8% fib level is at 142.82, expected to provide support.
USD/JPY advances for three straight days, climbing 0.11%, despite falling US Treasury bond yields and overall US Dollar (USD) weakness across the FX board, ahead of inflation data release from the United States (US). At the time of writing, the USD/JPY exchanges hands at 143.53 after hitting a low of 142.98.
Wall Street trades with minuscule losses amidst a light US economic docket as traders brace for July’s inflation data. The Consumer Price Index (CPI) is expected to remain unchanged compared to June’s 0.2% MoM, while market analysts foresee a dip to 3% from 3.3% YoY. Core CPI is estimated to print 0.2% MoM as the prior month’s release, and YoY is projected to stay at 4.8% as June’s.
Aside from this, the shrinkage of the trade deficit slightly boosted the greenback, but mixed messages from US Federal Reserve (Fed) officials, keep investors uncertain about the Fed’s forward path. Even though Fed Governor Michelle Bowman stressed the need for additional tightening, more policymakers are taking a more cautious or neutral approach, as Philadelphia Fed President Patrick Harker. He commented the Fed is at a stage where it could leave rates unchanged, barring an abrupt change in the direction of recent economic data.
Monetary policy expectations on the Fed show money market traders expect no change to the Federal Funds Rate (FFR), with odds at 86.5%, as shown by the CME FedWatch Tool.
The US Dollar Index (DXY), a gauge of the buck’s value against a basket of six currencies, is losing some traction, down by 0.11%, at 102.430, undermined by falling UST bond yields. The US 10-year benchmark note rate is 4.00%, down two basis points.
The lack of economic data in Japan would keep traders leaning toward US Dollar dynamics, as well as recent data from the Bank of Japan (BoJ), as most members of the BoJ expressed an opinion about the Yield Curve Control (YCC). Even though there was some chatter about normalizing monetary policy, most BoJ’s members remain on the dovish side of the spectrum.
The USD/JPY found support around the top of the Ichimoku Cloud (Kumo), briefly pierced on Monday. However, a ‘tweezers bottom and harami’ pattern exacerbated a recovery toward current exchange rates. In addition, the Tenkan-Sen is about to cross above the Kijun-Sen line, seen as a bullish signal, while the Chikou Span is still below the price action. That said, the USD/JPY is bullishly biased, and it might test the year-to-date (YTD) high at 145.07, but firstly it would need to surpass key resistance levels, like the psychological 144.00 figure. Conversely, if the major drops inside the Kumo, it could test the current week’s low of 141.50.
Technical Levels: Supports and Resistances
USDJPY currently trading at 143.71 at the time of writing. Pair opened at 143.38 and is trading with a change of 0.23 % .
| Overview | Overview.1 | |
|---|---|---|
| 0 | Today last price | 143.71 |
| 1 | Today Daily Change | 0.33 |
| 2 | Today Daily Change % | 0.23 |
| 3 | Today daily open | 143.38 |
The pair remains strongly bullish on the daily timeframe. It trades above its 20 SMA @ 140.84, 50 SMA 141.39, 100 SMA @ 138.1 and 200 SMA @ 136.53.
| Trends | Trends.1 | |
|---|---|---|
| 0 | Daily SMA20 | 140.84 |
| 1 | Daily SMA50 | 141.39 |
| 2 | Daily SMA100 | 138.10 |
| 3 | Daily SMA200 | 136.53 |
The previous day high was 143.5 while the previous day low was 142.4. The daily 38.2% Fib levels comes at 143.08, expected to provide support. Similarly, the daily 61.8% fib level is at 142.82, expected to provide support.
Note the levels of interest below:
- Pivot support is noted at 142.69, 142.0, 141.6
- Pivot resistance is noted at 143.78, 144.18, 144.87
| Levels | Levels.1 |
|---|---|
| Previous Daily High | 143.50 |
| Previous Daily Low | 142.40 |
| Previous Weekly High | 143.89 |
| Previous Weekly Low | 140.69 |
| Previous Monthly High | 144.91 |
| Previous Monthly Low | 137.24 |
| Daily Fibonacci 38.2% | 143.08 |
| Daily Fibonacci 61.8% | 142.82 |
| Daily Pivot Point S1 | 142.69 |
| Daily Pivot Point S2 | 142.00 |
| Daily Pivot Point S3 | 141.60 |
| Daily Pivot Point R1 | 143.78 |
| Daily Pivot Point R2 | 144.18 |
| Daily Pivot Point R3 | 144.87 |
[/s2If]
Download Nehcap EAWe have two EAs that are operational on our LIVE accounts.
- EA-FIX: Check out the details here. Download EA-FIX . EA-FIX is a non-grid HFT scalper.
- EA-GROWTH: High quality low dd EA using trend grids. Download EA_GROWTHJoin Our Telegram Group
")


