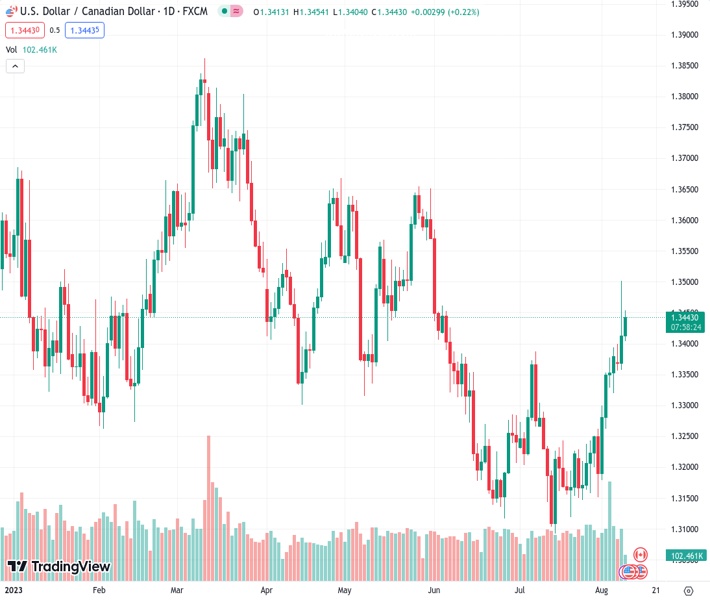
The USDCAD currency pair has experienced a bounce back from a support level at 1.3400 to the current price of 1.34442, following a shift in market sentiment towards a more cautious approach.
…
This is a premium post.
[s2If !current_user_can(access_s2member_level4)]Please register for FREE REGISTER to read full post below containing analysis. In case of any error or you think you are not able to read the full post below, please email us at support#nehcap.com [lwa][/s2If] [s2If current_user_can(access_s2member_level1)]
- USD/CAD rebounds after building a base around 1.3400 as the market mood turns cautious.
The pair currently trades last at 1.34442.
The previous day high was 1.3502 while the previous day low was 1.3365. The daily 38.2% Fib levels comes at 1.345, expected to provide resistance. Similarly, the daily 61.8% fib level is at 1.3417, expected to provide support.
The USD/CAD pair attempts to break the consolidation above the round-level support of 1.3400 in the European session. The Loonie asset finds strength as the US Dollar rebounds after discovering a cushion near 102.30.
Bearish sentiment revives as investors turn cautious ahead of the United States inflation data, which will be released on Thursday at 12:30 GMT. US headline inflation for July is expected to rebound as oil prices recovered sharply last month.
July’s inflation data is expected to build a base for Federal Reserve’s (Fed) September monetary policy as sticky price pressures would force policymakers to consider an extension of policy-tightening.
USD/CAD shifts auction above the horizontal resistance plotted from July 07 high at 1.3387 on a four-hour scale, which turns into a support for the US Dollar bulls. The Loonie asset is approaching the next resistance plotted around 1.3650. Upward-sloping 20-period Exponential Moving Average (EMA) at 1.3400 provides support to the US Dollar.
The Relative Strength Index (RSI) (14) oscillates in a 40.00-60.00 range, which indicates a consolidation ahead.
Mean-reversion move to near 1.3400 would be a buying opportunity for the US Dollar bulls. This would drive the asset toward June 05 high at 1.3462 followed by the psychological resistance at 1.3500.
In an alternate scenario, a downside move below July 18 high at 1.3288 would drag the asset toward July 27 low around 1.3160 and July 14 low marginally below 1.3100.
Technical Levels: Supports and Resistances
USDCAD currently trading at 1.3445 at the time of writing. Pair opened at 1.3419 and is trading with a change of 0.19 % .
| Overview | Overview.1 | |
|---|---|---|
| 0 | Today last price | 1.3445 |
| 1 | Today Daily Change | 0.0026 |
| 2 | Today Daily Change % | 0.1900 |
| 3 | Today daily open | 1.3419 |
The pair is trading above its 20 Daily moving average @ 1.324, above its 50 Daily moving average @ 1.3271 , above its 100 Daily moving average @ 1.3396 and below its 200 Daily moving average @ 1.3454
| Trends | Trends.1 | |
|---|---|---|
| 0 | Daily SMA20 | 1.3240 |
| 1 | Daily SMA50 | 1.3271 |
| 2 | Daily SMA100 | 1.3396 |
| 3 | Daily SMA200 | 1.3454 |
The previous day high was 1.3502 while the previous day low was 1.3365. The daily 38.2% Fib levels comes at 1.345, expected to provide resistance. Similarly, the daily 61.8% fib level is at 1.3417, expected to provide support.
Note the levels of interest below:
- Pivot support is noted at 1.3355, 1.3292, 1.3218
- Pivot resistance is noted at 1.3492, 1.3566, 1.3629
| Levels | Levels.1 |
|---|---|
| Previous Daily High | 1.3502 |
| Previous Daily Low | 1.3365 |
| Previous Weekly High | 1.3394 |
| Previous Weekly Low | 1.3151 |
| Previous Monthly High | 1.3387 |
| Previous Monthly Low | 1.3093 |
| Daily Fibonacci 38.2% | 1.3450 |
| Daily Fibonacci 61.8% | 1.3417 |
| Daily Pivot Point S1 | 1.3355 |
| Daily Pivot Point S2 | 1.3292 |
| Daily Pivot Point S3 | 1.3218 |
| Daily Pivot Point R1 | 1.3492 |
| Daily Pivot Point R2 | 1.3566 |
| Daily Pivot Point R3 | 1.3629 |
[/s2If]
Download Nehcap EAWe have two EAs that are operational on our LIVE accounts.
- EA-FIX: Check out the details here. Download EA-FIX . EA-FIX is a non-grid HFT scalper.
- EA-GROWTH: High quality low dd EA using trend grids. Download EA_GROWTHJoin Our Telegram Group
")


