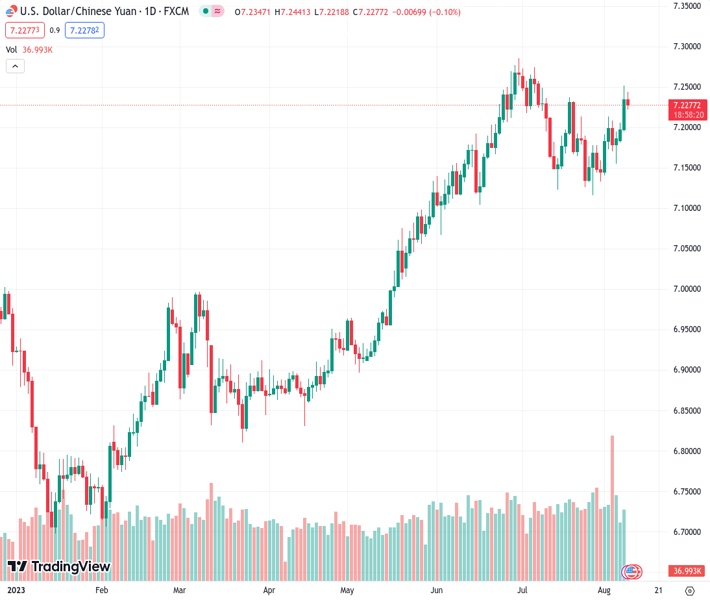
The USDCNH currency pair has experienced its first daily decline in four days following the release of China’s inflation data for July. Analysts predict that there will be potential for the currency pair to increase in value in the future.
…
This is a premium post.
[s2If !current_user_can(access_s2member_level4)]Please register for FREE REGISTER to read full post below containing analysis. In case of any error or you think you are not able to read the full post below, please email us at support#nehcap.com [lwa][/s2If] [s2If current_user_can(access_s2member_level1)]
- USD/CNH prints the first daily loss in four after China inflation data for July.
The pair currently trades last at 7.22805.
The previous day high was 7.2512 while the previous day low was 7.199. The daily 38.2% Fib levels comes at 7.2313, expected to provide resistance. Similarly, the daily 61.8% fib level is at 7.219, expected to provide support.
USD/CNH renews its intraday low near 7.2220 while reversing from a one-month-old horizontal resistance during early Wednesday. In doing so, the offshore Chinese Yuan (CNH) pair gives more importance to the improvement in the factory-gate inflation than the consumer price increase, as well as cheer the market’s stabilization, while snapping a three-day losing streak.
That said, China’s headline inflation gauge, namely the Consumer Price Index (CPI), declines to -0.3% YoY versus -0.4% YoY expected and 0.0% prior whereas the Producer Price Index (PPI) improves to -4.4% YoY compared to -4.1% YoY market forecasts and -5.4% previous readings.
Technically, the latest pullback remains elusive amid bullish MACD signals and an upbeat RSI (14) line.
Also challenging the short-term USD/CNH bears are the 21-DMA and a fortnight-long rising support line, respectively near 7.1815 and 7.1760.
Following that, the upward-sloping trend line from early May and February, close to 7.1480 and 7.0990 in that order, will be in the spotlight.
On the contrary, a daily closing beyond the aforementioned monthly horizontal resistance near 7.2370-80 could quickly propel the USD/CNH pair towards a descending trend line from late October 2022, surrounding 7.2730 by the press time.
In a case where the offshore Chinese Yuan manages to cross the 7.2730 hurdle, the yearly top marked in June near 7.2860 will act as the last defense of bears.
Trend: Further upside expected
Technical Levels: Supports and Resistances
USDCNH currently trading at 7.2272 at the time of writing. Pair opened at 7.2374 and is trading with a change of -0.14% % .
| Overview | Overview.1 | |
|---|---|---|
| 0 | Today last price | 7.2272 |
| 1 | Today Daily Change | -0.0102 |
| 2 | Today Daily Change % | -0.14% |
| 3 | Today daily open | 7.2374 |
The pair remains strongly bullish on the daily timeframe. It trades above its 20 SMA @ 7.1792, 50 SMA 7.1837, 100 SMA @ 7.0598 and 200 SMA @ 7.0014.
| Trends | Trends.1 | |
|---|---|---|
| 0 | Daily SMA20 | 7.1792 |
| 1 | Daily SMA50 | 7.1837 |
| 2 | Daily SMA100 | 7.0598 |
| 3 | Daily SMA200 | 7.0014 |
The previous day high was 7.2512 while the previous day low was 7.199. The daily 38.2% Fib levels comes at 7.2313, expected to provide resistance. Similarly, the daily 61.8% fib level is at 7.219, expected to provide support.
Note the levels of interest below:
- Pivot support is noted at 7.2072, 7.177, 7.155
- Pivot resistance is noted at 7.2594, 7.2814, 7.3116
| Levels | Levels.1 |
|---|---|
| Previous Daily High | 7.2512 |
| Previous Daily Low | 7.1990 |
| Previous Weekly High | 7.2130 |
| Previous Weekly Low | 7.1330 |
| Previous Monthly High | 7.2744 |
| Previous Monthly Low | 7.1160 |
| Daily Fibonacci 38.2% | 7.2313 |
| Daily Fibonacci 61.8% | 7.2190 |
| Daily Pivot Point S1 | 7.2072 |
| Daily Pivot Point S2 | 7.1770 |
| Daily Pivot Point S3 | 7.1550 |
| Daily Pivot Point R1 | 7.2594 |
| Daily Pivot Point R2 | 7.2814 |
| Daily Pivot Point R3 | 7.3116 |
[/s2If]
Download Nehcap EAWe have two EAs that are operational on our LIVE accounts.
- EA-FIX: Check out the details here. Download EA-FIX . EA-FIX is a non-grid HFT scalper.
- EA-GROWTH: High quality low dd EA using trend grids. Download EA_GROWTHJoin Our Telegram Group
")


