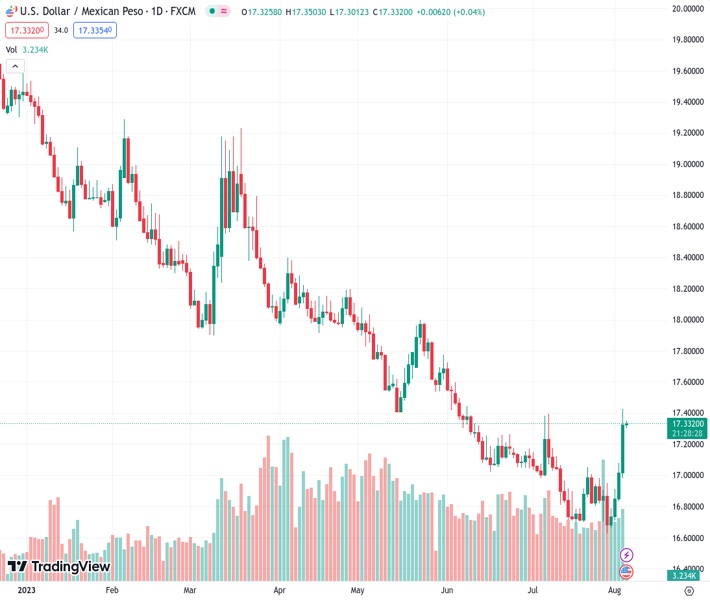
The USDMXN currency pair, which is currently at 17.3230, is facing difficulties in maintaining its recent gains at a two-month high. It is also testing a four-day upward trend before the release of the US Non-Farm Payrolls report. According to the perspective of @nehcap, a pullback in the pair is anticipated.
…
This is a premium post.
[s2If !current_user_can(access_s2member_level4)]Please register for FREE REGISTER to read full post below containing analysis. In case of any error or you think you are not able to read the full post below, please email us at support#nehcap.com [lwa][/s2If] [s2If current_user_can(access_s2member_level1)]
- USD/MXN struggles to defend recent gains at two-month high, prods four-day uptrend ahead of US NFP.
The pair currently trades last at 17.3230.
The previous day high was 17.08 while the previous day low was 16.8336. The daily 38.2% Fib levels comes at 16.9859, expected to provide support. Similarly, the daily 61.8% fib level is at 16.9277, expected to provide support.
USD/MXN prints mild losses around 17.33 as it reverses from the highest level in two months while consolidating the biggest daily gains since March amid early Friday in Asia. In doing so, the Mexican Peso (MXN) pair portrays the market’s cautious mood ahead of the top-tier US employment data.
Apart from the pre-NFP consolidation, overbought RSI (14) and a horizontal area comprising multiple levels marked since early June, around 17.39–43, also challenge the Mexican Peso sellers.
It’s worth noting, however, that the bullish MACD signals and the pair’s sustained trading beyond the previously key technical resistances, now supports, keep the USD/MXN buyers hopeful.
Among them, the resistance-turned-support line from May 23 and the 200-SMA, respectively near 17.04 and 16.98, gain major attention.
Following that, a one-week-old rising support line near 16.98 will act as the final defense of the USD/MXN buyers.
On the contrary, a daily closing beyond the 17.43 resistance will need validation from the 61.8% Fibonacci retracement of May–July downbeat, near 17.47, quickly followed by the 17.50 round figure, to convince the USD/MXN buyers.
In a case where the Mexican Peso bears keep the reins past 17.50, the odds of witnessing a move towards late May swing low near the 18.00 psychological magnet can’t be ruled out.
Trend: Pullback expected
Technical Levels: Supports and Resistances
USDMXN currently trading at 17.327 at the time of writing. Pair opened at 17.024 and is trading with a change of 1.78% % .
| Overview | Overview.1 | |
|---|---|---|
| 0 | Today last price | 17.327 |
| 1 | Today Daily Change | 0.3030 |
| 2 | Today Daily Change % | 1.78% |
| 3 | Today daily open | 17.024 |
The pair is trading above its 20 Daily moving average @ 16.8932, above its 50 Daily moving average @ 17.1306 , below its 100 Daily moving average @ 17.5921 and below its 200 Daily moving average @ 18.3413
| Trends | Trends.1 | |
|---|---|---|
| 0 | Daily SMA20 | 16.8932 |
| 1 | Daily SMA50 | 17.1306 |
| 2 | Daily SMA100 | 17.5921 |
| 3 | Daily SMA200 | 18.3413 |
The previous day high was 17.08 while the previous day low was 16.8336. The daily 38.2% Fib levels comes at 16.9859, expected to provide support. Similarly, the daily 61.8% fib level is at 16.9277, expected to provide support.
Note the levels of interest below:
- Pivot support is noted at 16.8785, 16.7329, 16.6322
- Pivot resistance is noted at 17.1248, 17.2255, 17.3711
| Levels | Levels.1 |
|---|---|
| Previous Daily High | 17.0800 |
| Previous Daily Low | 16.8336 |
| Previous Weekly High | 17.0097 |
| Previous Weekly Low | 16.6258 |
| Previous Monthly High | 17.3957 |
| Previous Monthly Low | 16.6258 |
| Daily Fibonacci 38.2% | 16.9859 |
| Daily Fibonacci 61.8% | 16.9277 |
| Daily Pivot Point S1 | 16.8785 |
| Daily Pivot Point S2 | 16.7329 |
| Daily Pivot Point S3 | 16.6322 |
| Daily Pivot Point R1 | 17.1248 |
| Daily Pivot Point R2 | 17.2255 |
| Daily Pivot Point R3 | 17.3711 |
[/s2If]
Download Nehcap EAWe have two EAs that are operational on our LIVE accounts.
- EA-FIX: Check out the details here. Download EA-FIX . EA-FIX is a non-grid HFT scalper.
- EA-GROWTH: High quality low dd EA using trend grids. Download EA_GROWTHJoin Our Telegram Group


