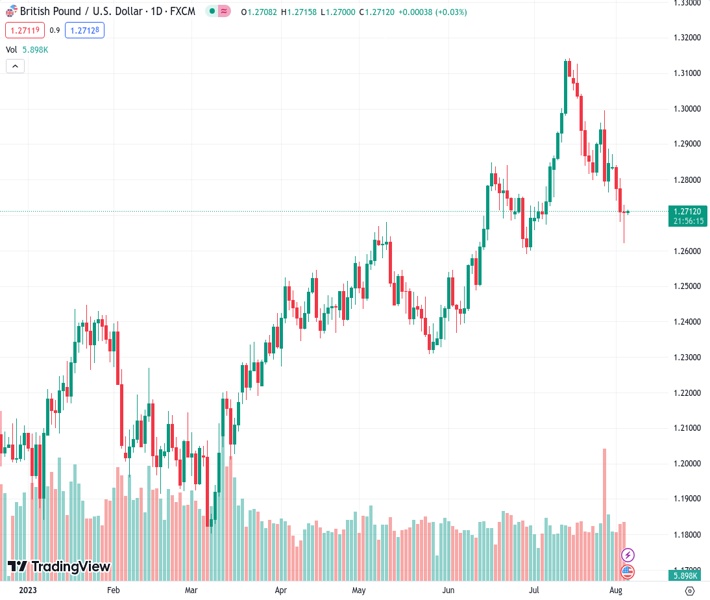
The GBPUSD currency pair remains cautious at a rate of 1.27136 after rebounding from its lowest point in five weeks. Analysts at nehcap anticipate that there will be more declines in the future.
…
This is a premium post.
[s2If !current_user_can(access_s2member_level4)]Please register for FREE REGISTER to read full post below containing analysis. In case of any error or you think you are not able to read the full post below, please email us at support#nehcap.com [lwa][/s2If] [s2If current_user_can(access_s2member_level1)]
- GBP/USD stays defensive after bouncing off a five-week low.
The pair currently trades last at 1.27136.
The previous day high was 1.2806 while the previous day low was 1.268. The daily 38.2% Fib levels comes at 1.2728, expected to provide resistance. Similarly, the daily 61.8% fib level is at 1.2758, expected to provide resistance.
GBP/USD treads water around 1.2730 as it defends the previous day’s rebound from the lowest levels in five weeks but lacks upside momentum during early Friday morning in Asia. In doing so, the Cable pair struggles to justify the previous day’s Dragonfly Doji bullish candlestick, as well as the downbeat RSI (14) line, amid a cautious mood ahead of the US Nonfarm Payrolls (NFP).
The reason could be linked to the Bank of England’s (BoE) dovish hike joining the bearish MACD signals and the Pound Sterling’s sustained trading beneath the previously key technical support.
Also raed: GBP/USD recovers slightly after BoE’s rate hike, soft US economic data
Among them, the 50-DMA level of around 1.2735 gains the immediate attention of the GBP/USD buyers ahead of the five-month-old support-turned-resistance line around 1.2750.
Also challenging the short-term Cable upside is a downward-sloping resistance line from July 14, close to 1.2805 at the latest.
Meanwhile, the Pound Sterling’s pullback remains elusive unless it defies the bullish candlestick formation by slipping beneath the latest low of 1.2620. Even so, the late June bottom of around 1.2590 can act as an additional downside filter for the GBP/USD bears.
Overall, GBP/USD is likely to remain depressed despite the bullish candlestick and the pre-NFP consolidation.
Trend: Further downside expected
Technical Levels: Supports and Resistances
GBPUSD currently trading at 1.2713 at the time of writing. Pair opened at 1.2712 and is trading with a change of 0.01% % .
| Overview | Overview.1 | |
|---|---|---|
| 0 | Today last price | 1.2713 |
| 1 | Today Daily Change | 0.0001 |
| 2 | Today Daily Change % | 0.01% |
| 3 | Today daily open | 1.2712 |
The pair is trading below its 20 Daily moving average @ 1.29, below its 50 Daily moving average @ 1.272 , above its 100 Daily moving average @ 1.2574 and above its 200 Daily moving average @ 1.2306
| Trends | Trends.1 | |
|---|---|---|
| 0 | Daily SMA20 | 1.2900 |
| 1 | Daily SMA50 | 1.2720 |
| 2 | Daily SMA100 | 1.2574 |
| 3 | Daily SMA200 | 1.2306 |
The previous day high was 1.2806 while the previous day low was 1.268. The daily 38.2% Fib levels comes at 1.2728, expected to provide resistance. Similarly, the daily 61.8% fib level is at 1.2758, expected to provide resistance.
Note the levels of interest below:
- Pivot support is noted at 1.2659, 1.2607, 1.2534
- Pivot resistance is noted at 1.2785, 1.2858, 1.291
| Levels | Levels.1 |
|---|---|
| Previous Daily High | 1.2806 |
| Previous Daily Low | 1.2680 |
| Previous Weekly High | 1.2996 |
| Previous Weekly Low | 1.2763 |
| Previous Monthly High | 1.3142 |
| Previous Monthly Low | 1.2659 |
| Daily Fibonacci 38.2% | 1.2728 |
| Daily Fibonacci 61.8% | 1.2758 |
| Daily Pivot Point S1 | 1.2659 |
| Daily Pivot Point S2 | 1.2607 |
| Daily Pivot Point S3 | 1.2534 |
| Daily Pivot Point R1 | 1.2785 |
| Daily Pivot Point R2 | 1.2858 |
| Daily Pivot Point R3 | 1.2910 |
[/s2If]
Download Nehcap EAWe have two EAs that are operational on our LIVE accounts.
- EA-FIX: Check out the details here. Download EA-FIX . EA-FIX is a non-grid HFT scalper.
- EA-GROWTH: High quality low dd EA using trend grids. Download EA_GROWTHJoin Our Telegram Group


