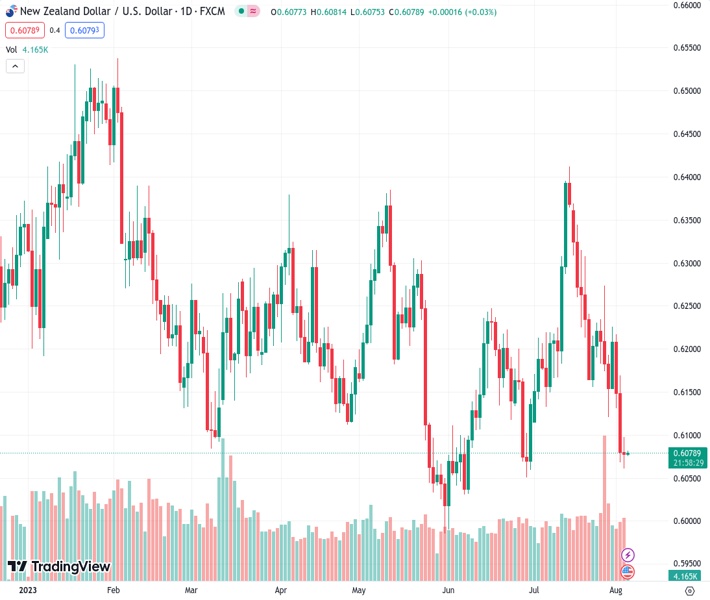
The NZDUSD currency pair is currently trading at 0.60770 and has been moving sideways between the 0.6075 and 0.6090 levels. This comes after experiencing a decline over the past two days.
…
This is a premium post.
[s2If !current_user_can(access_s2member_level4)]Please register for FREE REGISTER to read full post below containing analysis. In case of any error or you think you are not able to read the full post below, please email us at support#nehcap.com [lwa][/s2If] [s2If current_user_can(access_s2member_level1)]
- NZD/USD consolidates in the 0.6075-0.6090 range after posting two days of losses.
The pair currently trades last at 0.60770.
The previous day high was 0.6173 while the previous day low was 0.6068. The daily 38.2% Fib levels comes at 0.6108, expected to provide resistance. Similarly, the daily 61.8% fib level is at 0.6133, expected to provide resistance.
The NZD/USD pair oscillates in a narrow range below the 0.6080 mark in the early Asian session on Friday. Market participants prefer to wait on the sidelines ahead of the key events later in the day. The figure is expected to trigger volatility in the FX markets. Meanwhile, the US Dollar Index (DXY), a measure of the value of USD against six other major currencies, snaps a five-day winning streak and currently trades near 102.48.
Data released by the US Department of Labor on Thursday revealed that Initial Jobless Claims increased to 227,000 for the week ended July 29, matching expectations. The ISM Service PMI for July dropped to 52.7 from 53.9 prior and was worse than expected at 53. Lastly, Unit Labor Costs from Q2 came in at 1.6%, lower than the 2.6% expected.
Investors will take more cues from the US wage inflation and unemployment figures on Friday. The stronger data could convince the Federal Reserve (Fed) to hike additional rates this year, which benefits the US Dollar and acts as a headwind for the NZD/USD pair.
On the Kiwi front, Statistics New Zealand reported on Wednesday that the New Zealand Unemployment Rate for Q2 came in at 3.6%, above the consensus of 3.5% and 3.4% prior. Employment Change QoQ rose 1.0%, better than expected at 0.5% and 0.8% previously. The mixed New Zealand economic data undermines the NZD/USD risk-barometer pair.
Looking ahead, market participants will closely watch the US Nonfarm Payrolls, the Unemployment Rate and Average Hourly Earnings later in the American session. The US economy is expected to create 200,000 jobs in July, below the 209,000 in June, while the Unemployment Rate is expected to remain at 3.6%. These events could significantly impact the US Dollar’s dynamic and give the NZD/USD pair a clear direction.
Technical Levels: Supports and Resistances
NZDUSD currently trading at 0.608 at the time of writing. Pair opened at 0.608 and is trading with a change of 0.0 % .
| Overview | Overview.1 | |
|---|---|---|
| 0 | Today last price | 0.608 |
| 1 | Today Daily Change | 0.000 |
| 2 | Today Daily Change % | 0.000 |
| 3 | Today daily open | 0.608 |
The pair remains strongly bearish on the daily time frame. It trades below the 20 SMA @ 0.6225, 50 SMA 0.6164, 100 SMA @ 0.6196 and 200 SMA @ 0.6225.
| Trends | Trends.1 | |
|---|---|---|
| 0 | Daily SMA20 | 0.6225 |
| 1 | Daily SMA50 | 0.6164 |
| 2 | Daily SMA100 | 0.6196 |
| 3 | Daily SMA200 | 0.6225 |
The previous day high was 0.6173 while the previous day low was 0.6068. The daily 38.2% Fib levels comes at 0.6108, expected to provide resistance. Similarly, the daily 61.8% fib level is at 0.6133, expected to provide resistance.
Note the levels of interest below:
- Pivot support is noted at 0.6041, 0.6002, 0.5936
- Pivot resistance is noted at 0.6146, 0.6212, 0.6252
| Levels | Levels.1 |
|---|---|
| Previous Daily High | 0.6173 |
| Previous Daily Low | 0.6068 |
| Previous Weekly High | 0.6274 |
| Previous Weekly Low | 0.6120 |
| Previous Monthly High | 0.6413 |
| Previous Monthly Low | 0.6120 |
| Daily Fibonacci 38.2% | 0.6108 |
| Daily Fibonacci 61.8% | 0.6133 |
| Daily Pivot Point S1 | 0.6041 |
| Daily Pivot Point S2 | 0.6002 |
| Daily Pivot Point S3 | 0.5936 |
| Daily Pivot Point R1 | 0.6146 |
| Daily Pivot Point R2 | 0.6212 |
| Daily Pivot Point R3 | 0.6252 |
[/s2If]
Download Nehcap EAWe have two EAs that are operational on our LIVE accounts.
- EA-FIX: Check out the details here. Download EA-FIX . EA-FIX is a non-grid HFT scalper.
- EA-GROWTH: High quality low dd EA using trend grids. Download EA_GROWTHJoin Our Telegram Group
")


