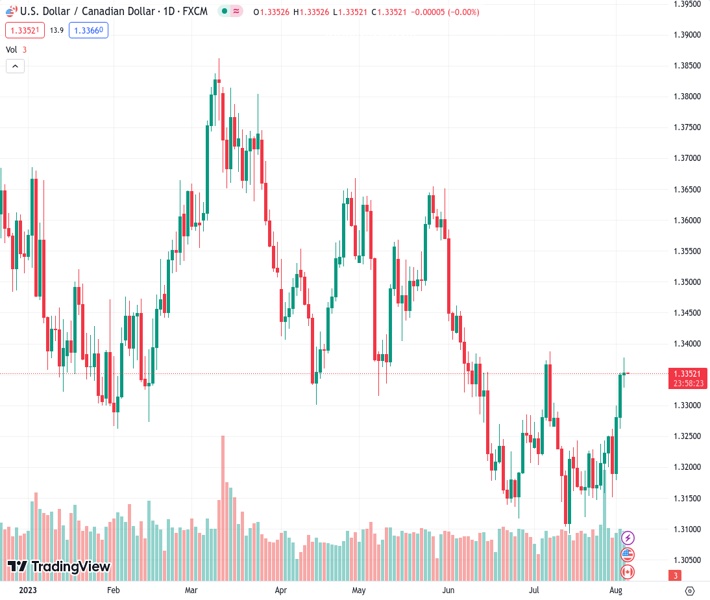
The USDCAD currency pair reached its highest level of 1.3377 during the day before stabilizing at 1.3355, while still maintaining its overall daily gains.
…
This is a premium post.
[s2If !current_user_can(access_s2member_level4)]Please register for FREE REGISTER to read full post below containing analysis. In case of any error or you think you are not able to read the full post below, please email us at support#nehcap.com [lwa][/s2If] [s2If current_user_can(access_s2member_level1)]
- USD/CAD peaked at a daily high of 1.3377 and then consolidated at 1.3355, still holding daily gains.
The pair currently trades last at 1.33530.
The previous day high was 1.3354 while the previous day low was 1.3266. The daily 38.2% Fib levels comes at 1.332, expected to provide support. Similarly, the daily 61.8% fib level is at 1.3299, expected to provide support.
On Thursday’s session, the USD/CAD reversed as the USD lost traction following weak mid-tier economic data. The pair rose to nearly 1.3380 and then settled at 1.3355, while the CAD also benefited from rising Oil prices.
In July, the US Services sector displayed some weakness on the data front but stayed resilient. The S&P index came in at 52.3, lower than the consensus and previous figures of 52.4, while the Institute for Supply Management (ISM) came in at 52.7, failing to live up to the expected 53 and the last 53.9.
Labour market data indicated a slight increase in Jobless Claims to 227,000 at the end of July, as anticipated. However, Unit Labor Costs from Q2 rose by 1.6%, falling short of the expected 2.6% and the previous 3.3%. On Friday, Nonfarm Payrolls (NFPs) will offer investors a clearer outlook on the sector, along with wage inflation and unemployment figures. Overall, data on Thursday showed that the US Services sector remains resilient, but the labour market signals are mixed so NFP data will be closely watched.
On the CAD side, no relevant data will be released by Canada for the rest of the week. Rising Oil prices are giving traction to the Canadian currency, as the West Texas Intermediate (WTI) barrel rose more than 2% to $81.68 on the back of expectations of production cuts by Saudi Arabia in September.
The technical analysis for USD/CAD on the daily chart suggests a neutral to bearish outlook as the bulls show signs of exhaustion. While the Relative Strength Index (RSI) maintains a negative slope above its midline, the Moving Average Convergence Divergence (MACD) printed neutral green bars. On the other hand, the pair is above the 20-day Simple Moving Average (SMA) but below the 100 and 200-day SMAs, suggesting that despite the recent bearish sentiment, the bulls are still resilient, holding some momentum.
Resistance levels: 1.3385 (July’s high), 1.3405 (100-day SMA), 1.3454 (200-day SMA).
Support levels: 1.3280, 1.3250, 1.3240.
Technical Levels: Supports and Resistances
USDCAD currently trading at 1.3354 at the time of writing. Pair opened at 1.335 and is trading with a change of 0.03 % .
| Overview | Overview.1 | |
|---|---|---|
| 0 | Today last price | 1.3354 |
| 1 | Today Daily Change | 0.0004 |
| 2 | Today Daily Change % | 0.0300 |
| 3 | Today daily open | 1.3350 |
The pair is trading above its 20 Daily moving average @ 1.3222, above its 50 Daily moving average @ 1.329 , below its 100 Daily moving average @ 1.3409 and below its 200 Daily moving average @ 1.3458
| Trends | Trends.1 | |
|---|---|---|
| 0 | Daily SMA20 | 1.3222 |
| 1 | Daily SMA50 | 1.3290 |
| 2 | Daily SMA100 | 1.3409 |
| 3 | Daily SMA200 | 1.3458 |
The previous day high was 1.3354 while the previous day low was 1.3266. The daily 38.2% Fib levels comes at 1.332, expected to provide support. Similarly, the daily 61.8% fib level is at 1.3299, expected to provide support.
Note the levels of interest below:
- Pivot support is noted at 1.3293, 1.3236, 1.3205
- Pivot resistance is noted at 1.3381, 1.3411, 1.3469
| Levels | Levels.1 |
|---|---|
| Previous Daily High | 1.3354 |
| Previous Daily Low | 1.3266 |
| Previous Weekly High | 1.3255 |
| Previous Weekly Low | 1.3147 |
| Previous Monthly High | 1.3387 |
| Previous Monthly Low | 1.3093 |
| Daily Fibonacci 38.2% | 1.3320 |
| Daily Fibonacci 61.8% | 1.3299 |
| Daily Pivot Point S1 | 1.3293 |
| Daily Pivot Point S2 | 1.3236 |
| Daily Pivot Point S3 | 1.3205 |
| Daily Pivot Point R1 | 1.3381 |
| Daily Pivot Point R2 | 1.3411 |
| Daily Pivot Point R3 | 1.3469 |
[/s2If]
Download Nehcap EAWe have two EAs that are operational on our LIVE accounts.
- EA-FIX: Check out the details here. Download EA-FIX . EA-FIX is a non-grid HFT scalper.
- EA-GROWTH: High quality low dd EA using trend grids. Download EA_GROWTHJoin Our Telegram Group
")


