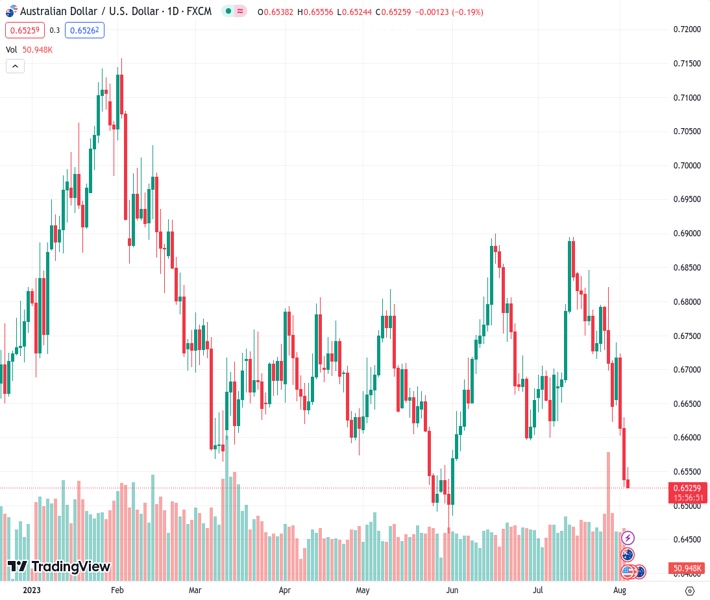
The AUDUSD pair is experiencing continuous downward pressure, hovering around the 0.6530 level on Thursday.
…
This is a premium post.
[s2If !current_user_can(access_s2member_level4)]Please register for FREE REGISTER to read full post below containing analysis. In case of any error or you think you are not able to read the full post below, please email us at support#nehcap.com [lwa][/s2If] [s2If current_user_can(access_s2member_level1)]
- AUD/USD remains under pressure around the 0.6530 mark on Thursday.
The pair currently trades last at 0.65260.
The previous day high was 0.663 while the previous day low was 0.6527. The daily 38.2% Fib levels comes at 0.6566, expected to provide resistance. Similarly, the daily 61.8% fib level is at 0.6591, expected to provide resistance.
The AUD/USD pair extends its downside above the 0.6500 area during the Asian session on Thursday. The pair loses traction for the second consecutive day following the softer Australian data and the risk-off mood in the market. AUD/USD currently trades around 0.6532, losing 0.1% for the day.
The latest data from the Australian Bureau of Statistics (ABS) showed that the Australian Trade Balance was A$11,321M, marginally lower than the A$11.791M recorded in May. Exports declined 2% as coal, mineral fuels, and metals shipments slowed in response to a decline in commodity demand in China. However, the decline in exports was offset by a 4% decline in imports in May. Meanwhile, Retail Sales QoQ came in at -0.5% from -0.6% prior.
The Reserve Bank of Australia (RBA) Governor Phillip Lowe remarked that the decision to keep rates intact gives the RBA more time to analyse the impact of the interest rate hikes and the economic outlook. However, more monetary policy tightening may be necessary to guarantee that inflation returns to target in a reasonable timeframe, but this will depend on the data and the developing risk assessment.
It’s worth noting that China’s Caixin Services PMI climbed to 54.1 in July from 53.9 prior, better than the market consensus of 52.5. The upbeat Chinese economic figure could benefit the China-proxy Australian Dollar (AUD).
On the US Dollar front, Automatic Data Processing Inc. (ADP) revealed on Wednesday that the number of employed people in the US private sector rose by 324K, above estimates of 189K and lower than the revised reading of 455,000 in June. This figure is above the 12-month average. The employment data could convince the Federal Reserve (Fed) to hike additional rates this year, which benefits the US Dollar and acts as a headwind for AUD/USD.
Market participants will take cues from the US weekly Jobless Claims, Unit Labour Costs and ISM Service PMI later in the North American session. On Friday, attention will shift to the US Nonfarm Payrolls. The US economy is expected to have created 180,000 jobs.
Technical Levels: Supports and Resistances
AUDUSD currently trading at 0.6529 at the time of writing. Pair opened at 0.6538 and is trading with a change of -0.14 % .
| Overview | Overview.1 | |
|---|---|---|
| 0 | Today last price | 0.6529 |
| 1 | Today Daily Change | -0.0009 |
| 2 | Today Daily Change % | -0.1400 |
| 3 | Today daily open | 0.6538 |
The pair remains strongly bearish on the daily time frame. It trades below the 20 SMA @ 0.6731, 50 SMA 0.67, 100 SMA @ 0.6692 and 200 SMA @ 0.6732.
| Trends | Trends.1 | |
|---|---|---|
| 0 | Daily SMA20 | 0.6731 |
| 1 | Daily SMA50 | 0.6700 |
| 2 | Daily SMA100 | 0.6692 |
| 3 | Daily SMA200 | 0.6732 |
The previous day high was 0.663 while the previous day low was 0.6527. The daily 38.2% Fib levels comes at 0.6566, expected to provide resistance. Similarly, the daily 61.8% fib level is at 0.6591, expected to provide resistance.
Note the levels of interest below:
- Pivot support is noted at 0.65, 0.6462, 0.6397
- Pivot resistance is noted at 0.6603, 0.6668, 0.6706
| Levels | Levels.1 |
|---|---|
| Previous Daily High | 0.6630 |
| Previous Daily Low | 0.6527 |
| Previous Weekly High | 0.6821 |
| Previous Weekly Low | 0.6623 |
| Previous Monthly High | 0.6895 |
| Previous Monthly Low | 0.6599 |
| Daily Fibonacci 38.2% | 0.6566 |
| Daily Fibonacci 61.8% | 0.6591 |
| Daily Pivot Point S1 | 0.6500 |
| Daily Pivot Point S2 | 0.6462 |
| Daily Pivot Point S3 | 0.6397 |
| Daily Pivot Point R1 | 0.6603 |
| Daily Pivot Point R2 | 0.6668 |
| Daily Pivot Point R3 | 0.6706 |
[/s2If]
Download Nehcap EAWe have two EAs that are operational on our LIVE accounts.
- EA-FIX: Check out the details here. Download EA-FIX . EA-FIX is a non-grid HFT scalper.
- EA-GROWTH: High quality low dd EA using trend grids. Download EA_GROWTHJoin Our Telegram Group
")


