The USDINR currency pair has fluctuated at its highest levels in three weeks after experiencing its biggest gain in a month the day before. According to the analysis by @nehcap, it is anticipated that there will be additional upward movement.
…
This is a premium post.
[s2If !current_user_can(access_s2member_level4)]Please register for FREE REGISTER to read full post below containing analysis. In case of any error or you think you are not able to read the full post below, please email us at support#nehcap.com [lwa][/s2If] [s2If current_user_can(access_s2member_level1)]
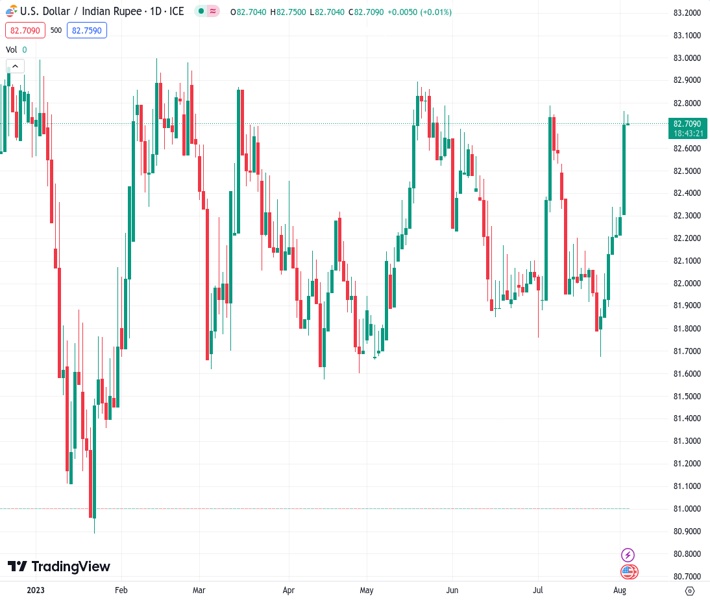
- USD/INR seesaws at the highest levels in three weeks after rising the most in a month the previous day.
The pair currently trades last at 82.7260.
The previous day high was 82.8166 while the previous day low was 82.2924. The daily 38.2% Fib levels comes at 82.6164, expected to provide support. Similarly, the daily 61.8% fib level is at 82.4927, expected to provide support.
USD/INR bulls keep the reins for the fourth consecutive day as they prod a 10-week-old resistance around 82.75 during early Thursday. In doing so, the Indian Rupee (INR) pair justifies the upside break of the 200-SMA and the bullish MACD signals amid the overbought RSI (14) line.
Even if the RSI conditions prod the Indian Rupee sellers at the key resistance line stretched from late May, fundamentals favoring the US Dollar and the quote’s sustained trading beyond the key SMA, as well as above a one-week-old support line keep the USD/INR buyers hopeful.
With this, the quote is likely to cross the 82.75 hurdle and prod the previous monthly high of around 82.83.
However, multiple tops marked in May around the 83.00 round figure may challenge the USD/INR buyers afterward.
Alternatively, a pullback move remains unimpressive beyond the early June swing high of around 82.60.
Following that, the aforementioned support line and the 200-SMA, respectively near 82.40 and 82.15, will act as the last defense of the USD/INR buyers.
Overall, the cautious mood ahead of multiple US data allows USD/INR bulls to take a breather but the bullish bias remains intact.
Also read: US Dollar Index: DXY traces yields to refresh multi-day top below 103.00 ahead of US ISM Services PMI
Trend: Further upside expected
Technical Levels: Supports and Resistances
USDINR currently trading at 82.7558 at the time of writing. Pair opened at 82.7245 and is trading with a change of 0.04% % .
| Overview | Overview.1 | |
|---|---|---|
| 0 | Today last price | 82.7558 |
| 1 | Today Daily Change | 0.0313 |
| 2 | Today Daily Change % | 0.04% |
| 3 | Today daily open | 82.7245 |
The pair remains strongly bullish on the daily timeframe. It trades above its 20 SMA @ 82.2392, 50 SMA 82.2448, 100 SMA @ 82.1976 and 200 SMA @ 82.1621.
| Trends | Trends.1 | |
|---|---|---|
| 0 | Daily SMA20 | 82.2392 |
| 1 | Daily SMA50 | 82.2448 |
| 2 | Daily SMA100 | 82.1976 |
| 3 | Daily SMA200 | 82.1621 |
The previous day high was 82.8166 while the previous day low was 82.2924. The daily 38.2% Fib levels comes at 82.6164, expected to provide support. Similarly, the daily 61.8% fib level is at 82.4927, expected to provide support.
Note the levels of interest below:
- Pivot support is noted at 82.4058, 82.087, 81.8816
- Pivot resistance is noted at 82.93, 83.1354, 83.4542
| Levels | Levels.1 |
|---|---|
| Previous Daily High | 82.8166 |
| Previous Daily Low | 82.2924 |
| Previous Weekly High | 82.3860 |
| Previous Weekly Low | 81.6588 |
| Previous Monthly High | 82.8334 |
| Previous Monthly Low | 81.6588 |
| Daily Fibonacci 38.2% | 82.6164 |
| Daily Fibonacci 61.8% | 82.4927 |
| Daily Pivot Point S1 | 82.4058 |
| Daily Pivot Point S2 | 82.0870 |
| Daily Pivot Point S3 | 81.8816 |
| Daily Pivot Point R1 | 82.9300 |
| Daily Pivot Point R2 | 83.1354 |
| Daily Pivot Point R3 | 83.4542 |
[/s2If]
Download Nehcap EAWe have two EAs that are operational on our LIVE accounts.
- EA-FIX: Check out the details here. Download EA-FIX . EA-FIX is a non-grid HFT scalper.
- EA-GROWTH: High quality low dd EA using trend grids. Download EA_GROWTHJoin Our Telegram Group
")


