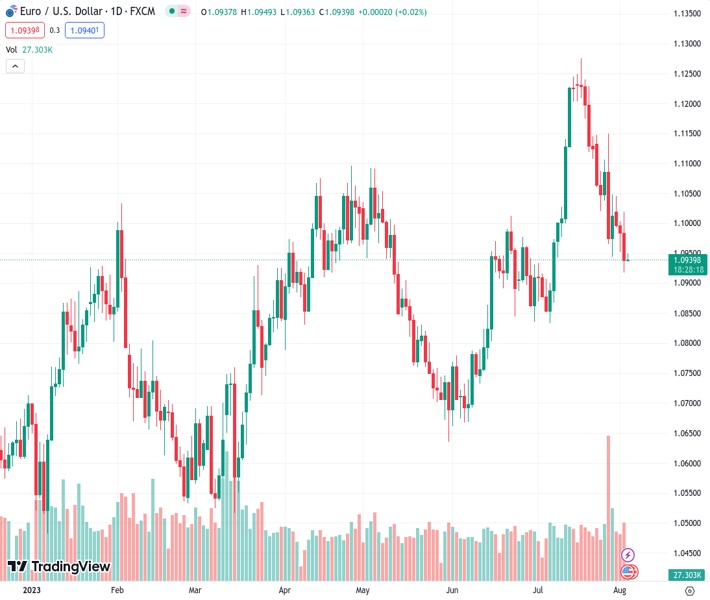
The EURUSD currency pair, currently at a rate of 1.09394, has rebounded from a declining support line that has been in place for the past three weeks. This rebound is a part of a bullish chart pattern known as a falling wedge. The perspective of Nehcap suggests that this rebound is a corrective bounce and is expected to continue.
…
This is a premium post.
[s2If !current_user_can(access_s2member_level4)]Please register for FREE REGISTER to read full post below containing analysis. In case of any error or you think you are not able to read the full post below, please email us at support#nehcap.com [lwa][/s2If] [s2If current_user_can(access_s2member_level1)]
- EUR/USD bounces off three-week-old falling support line, forming part of falling wedge bullish chart formation.
The pair currently trades last at 1.09394.
The previous day high was 1.102 while the previous day low was 1.0918. The daily 38.2% Fib levels comes at 1.0957, expected to provide resistance. Similarly, the daily 61.8% fib level is at 1.0981, expected to provide resistance.
EUR/USD licks its wounds at the lowest level since July 07 as it bounces off a three-week-old descending support line during early Thursday, defensive around 1.0940 by the press time.
In doing so, the Euro pair takes clues from the oversold RSI (14) line, as well as the market’s positioning for inflation and employment clues from the Eurozone and the US. Furthermore, the recently firmer S&P500 Futures and a pullback in the Treasury bond yields also allow the EUR/USD pair to consolidate recent losses.
However, the EUR/USD bears remain hopeful unless the quote stays below the support-turned-resistance line stretched from May 31, around 1.0980 by the press time.
Following that, the 38.2% Fibonacci retracement of its May-July upside, near 1.1040, and the stated falling wedge’s top line, close to 1.1065, will be in the spotlight.
Should the EUR/USD price rises past 1.1065, the pair can rise towards the previous monthly high of 1.1275 with the theoretical target of the falling wedge breakout of 1.1420 likely luring the Euro buyers afterward.
On the flip side, the stated wedge’s bottom line puts a floor under the EUR/USD price near 1.0910 ahead of highlighting the 61.8% Fibonacci retracement level of 1.0880 and the previous monthly bottom of around 1.0835.
Also read: EUR/USD sellers flirt with 1.0950 at one-month low, EU/US economics, Treasury bond yields eyed
Trend: Corrective bounce expected
Technical Levels: Supports and Resistances
EURUSD currently trading at 1.0942 at the time of writing. Pair opened at 1.0938 and is trading with a change of 0.04% % .
| Overview | Overview.1 | |
|---|---|---|
| 0 | Today last price | 1.0942 |
| 1 | Today Daily Change | 0.0004 |
| 2 | Today Daily Change % | 0.04% |
| 3 | Today daily open | 1.0938 |
The pair is trading below its 20 Daily moving average @ 1.1074, above its 50 Daily moving average @ 1.0926 , above its 100 Daily moving average @ 1.0913 and above its 200 Daily moving average @ 1.0734
| Trends | Trends.1 | |
|---|---|---|
| 0 | Daily SMA20 | 1.1074 |
| 1 | Daily SMA50 | 1.0926 |
| 2 | Daily SMA100 | 1.0913 |
| 3 | Daily SMA200 | 1.0734 |
The previous day high was 1.102 while the previous day low was 1.0918. The daily 38.2% Fib levels comes at 1.0957, expected to provide resistance. Similarly, the daily 61.8% fib level is at 1.0981, expected to provide resistance.
Note the levels of interest below:
- Pivot support is noted at 1.0898, 1.0857, 1.0796
- Pivot resistance is noted at 1.1, 1.1061, 1.1102
| Levels | Levels.1 |
|---|---|
| Previous Daily High | 1.1020 |
| Previous Daily Low | 1.0918 |
| Previous Weekly High | 1.1150 |
| Previous Weekly Low | 1.0944 |
| Previous Monthly High | 1.1276 |
| Previous Monthly Low | 1.0834 |
| Daily Fibonacci 38.2% | 1.0957 |
| Daily Fibonacci 61.8% | 1.0981 |
| Daily Pivot Point S1 | 1.0898 |
| Daily Pivot Point S2 | 1.0857 |
| Daily Pivot Point S3 | 1.0796 |
| Daily Pivot Point R1 | 1.1000 |
| Daily Pivot Point R2 | 1.1061 |
| Daily Pivot Point R3 | 1.1102 |
[/s2If]
Download Nehcap EAWe have two EAs that are operational on our LIVE accounts.
- EA-FIX: Check out the details here. Download EA-FIX . EA-FIX is a non-grid HFT scalper.
- EA-GROWTH: High quality low dd EA using trend grids. Download EA_GROWTHJoin Our Telegram Group
")


