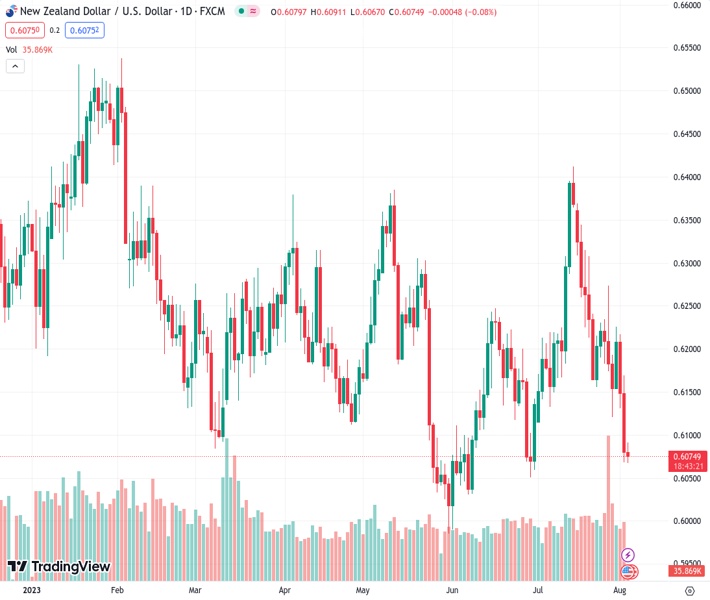
On Thursday, the NZDUSD pair, currently at 0.60763, begins a period of consolidation in a bearish manner and remains close to a low point that has been sustained for several weeks.
…
This is a premium post.
[s2If !current_user_can(access_s2member_level4)]Please register for FREE REGISTER to read full post below containing analysis. In case of any error or you think you are not able to read the full post below, please email us at support#nehcap.com [lwa][/s2If] [s2If current_user_can(access_s2member_level1)]
- NZD/USD enters a bearish consolidation phase on Thursday and hangs near a multi-week low.
The pair currently trades last at 0.60763.
The previous day high was 0.6173 while the previous day low was 0.6068. The daily 38.2% Fib levels comes at 0.6108, expected to provide resistance. Similarly, the daily 61.8% fib level is at 0.6133, expected to provide resistance.
The NZD/USD pair seesaws between tepid gains/minor losses through the Asian session and consolidates its recent decline to a five-week low touched earlier this Thursday. Spot prices currently trade around the 0.6080-0.6075 region, nearly unchanged for the day and seem vulnerable to slide further.
As investors digest the Fitch downgrade of the US credit rating, a modest recovery in the US equity futures turns out to be a key factor benefitting the risk-sensitive Kiwi and lending some support to the NZD/USD pair. A positive risk tone, meanwhile, keeps a lid on the recent US Dollar (USD) rally to its highest level since July 7, which, along with the better-than-expected China’s Caixin Services PMI, acts as a tailwind for the major. That said, firming expectations that the Federal Reserve (Fed) will stick to its hawkish stance favours the USD bulls and supports prospects for an extension of the pair’s three-week-old downtrend.
The US ADP report released on Wednesday showed that private-sector employers added 324K jobs in July, much higher than the 189K expected. This, along with the recent upbeat US macro data, points to an extremely resilient economy and should allow the Fed to keep interest rates higher for longer. The hawkish outlook remains supportive of elevated US Treasury bond yields and suggests that the path of least resistance for the USD is to the upside. This, in turn, adds credence to the near-term negative outlook for the NZD/USD pair and warrants some caution before placing bullish bets or positioning for any meaningful recovery.
Market participants now look forward to the US economic docket, featuring the release of the usual Weekly Initial Jobless Claims, the ISM Services PMI and Factory Orders data later during the early North American session. This, along with the US bond yields and the broader risk sentiment, might influence the USD price dynamics and produce short-term trading opportunities around the NZD/USD pair. The market focus, however, will remain glued to closely-watched US monthly employment details on Friday. The popularly known NFP report should help investors to determine the next leg of a directional move for the major.
Technical Levels: Supports and Resistances
NZDUSD currently trading at 0.6082 at the time of writing. Pair opened at 0.608 and is trading with a change of 0.03 % .
| Overview | Overview.1 | |
|---|---|---|
| 0 | Today last price | 0.6082 |
| 1 | Today Daily Change | 0.0002 |
| 2 | Today Daily Change % | 0.0300 |
| 3 | Today daily open | 0.6080 |
The pair remains strongly bearish on the daily time frame. It trades below the 20 SMA @ 0.6225, 50 SMA 0.6164, 100 SMA @ 0.6196 and 200 SMA @ 0.6225.
| Trends | Trends.1 | |
|---|---|---|
| 0 | Daily SMA20 | 0.6225 |
| 1 | Daily SMA50 | 0.6164 |
| 2 | Daily SMA100 | 0.6196 |
| 3 | Daily SMA200 | 0.6225 |
The previous day high was 0.6173 while the previous day low was 0.6068. The daily 38.2% Fib levels comes at 0.6108, expected to provide resistance. Similarly, the daily 61.8% fib level is at 0.6133, expected to provide resistance.
Note the levels of interest below:
- Pivot support is noted at 0.6041, 0.6002, 0.5936
- Pivot resistance is noted at 0.6146, 0.6212, 0.6252
| Levels | Levels.1 |
|---|---|
| Previous Daily High | 0.6173 |
| Previous Daily Low | 0.6068 |
| Previous Weekly High | 0.6274 |
| Previous Weekly Low | 0.6120 |
| Previous Monthly High | 0.6413 |
| Previous Monthly Low | 0.6120 |
| Daily Fibonacci 38.2% | 0.6108 |
| Daily Fibonacci 61.8% | 0.6133 |
| Daily Pivot Point S1 | 0.6041 |
| Daily Pivot Point S2 | 0.6002 |
| Daily Pivot Point S3 | 0.5936 |
| Daily Pivot Point R1 | 0.6146 |
| Daily Pivot Point R2 | 0.6212 |
| Daily Pivot Point R3 | 0.6252 |
[/s2If]
Download Nehcap EAWe have two EAs that are operational on our LIVE accounts.
- EA-FIX: Check out the details here. Download EA-FIX . EA-FIX is a non-grid HFT scalper.
- EA-GROWTH: High quality low dd EA using trend grids. Download EA_GROWTHJoin Our Telegram Group
")


