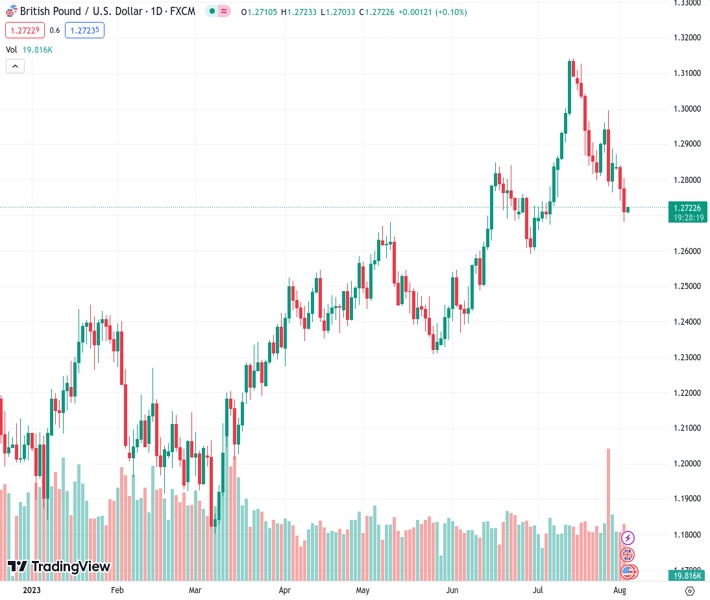
The GBPUSD pair, which is currently at 1.27210, is observed to be in a consolidation phase after experiencing a significant decline that brought it close to its lowest level in nearly a month.
…
This is a premium post.
[s2If !current_user_can(access_s2member_level4)]Please register for FREE REGISTER to read full post below containing analysis. In case of any error or you think you are not able to read the full post below, please email us at support#nehcap.com [lwa][/s2If] [s2If current_user_can(access_s2member_level1)]
- GBP/USD is seen consolidating its recent downfall to a nearly one-month trough.
The pair currently trades last at 1.27210.
The previous day high was 1.2806 while the previous day low was 1.268. The daily 38.2% Fib levels comes at 1.2728, expected to provide resistance. Similarly, the daily 61.8% fib level is at 1.2758, expected to provide resistance.
The GBP/USD pair enters a bearish consolidation phase during the Asian session on Thursday and oscillates in a narrow range just above a nearly one-month low, around the 1.2680 region touched the previous day. Spot prices currently trade around the 1.2700 mark as traders seem reluctant to place aggressive bets and prefer to wait for the latest monetary policy update from the Bank of England (BoE), due later today.
A sharp deceleration in the headline UK CPI, to the 7.9% YoY rate in June from the 8.7% previous, might force the UK central bank to revert to a smaller 25 bps lift-off. The move will push the benchmark rate to 5.25%, or the highest level since December 2007. That said, some investors are anticipating another 50 bps rate hike as the inflation is still significantly above the BoE’s 2% target. Hence, the focus will remain glued to the accompanying monetary policy statement and the post-meeting press conference. Against the backdrop of the recent swings in expectations about the future rate-hike path, the outlook will play a key role in influencing the British Pound and provide a fresh directional impetus to the GBP/USD pair.
In the meantime, the underlying bullish sentiment surrounding the US Dollar (USD) is seen acting as a headwind for spot prices. In fact, the USD Index (DXY), which tracks the Greenback against a basket of currencies, stands tall near its highest level since July 7 and remains supported by expectations that the resilient US economy should allow the Federal Reserve (Fed) to keep rates higher for longer. The bets were reaffirmed by the upbeat US ADP report, which showed that private-sector employers added 324K jobs in July against the 189K expected. This overshadows the Fitch downgrade of the US credit rating and remains supportive of elevated US Treasury bond yields, which underpins the USD and caps the GBP/USD pair.
Apart from the key central bank event risk, traders on Thursday will confront the release of US macro data – the usual Weekly Initial Jobless Claims, the ISM Services PMI and Factory Orders – later during the early North American session. This, along with the US bond yields and the broader risk sentiment, will drive the USD demand and contribute to producing short-term trading opportunities around the GBP/USD pair. The market attention will then turn to the closely-watched US monthly employment details, popularly known as the NFP report on Friday.
Technical Levels: Supports and Resistances
GBPUSD currently trading at 1.2715 at the time of writing. Pair opened at 1.2712 and is trading with a change of 0.02 % .
| Overview | Overview.1 | |
|---|---|---|
| 0 | Today last price | 1.2715 |
| 1 | Today Daily Change | 0.0003 |
| 2 | Today Daily Change % | 0.0200 |
| 3 | Today daily open | 1.2712 |
The pair is trading below its 20 Daily moving average @ 1.29, below its 50 Daily moving average @ 1.272 , above its 100 Daily moving average @ 1.2574 and above its 200 Daily moving average @ 1.2306
| Trends | Trends.1 | |
|---|---|---|
| 0 | Daily SMA20 | 1.2900 |
| 1 | Daily SMA50 | 1.2720 |
| 2 | Daily SMA100 | 1.2574 |
| 3 | Daily SMA200 | 1.2306 |
The previous day high was 1.2806 while the previous day low was 1.268. The daily 38.2% Fib levels comes at 1.2728, expected to provide resistance. Similarly, the daily 61.8% fib level is at 1.2758, expected to provide resistance.
Note the levels of interest below:
- Pivot support is noted at 1.2659, 1.2607, 1.2534
- Pivot resistance is noted at 1.2785, 1.2858, 1.291
| Levels | Levels.1 |
|---|---|
| Previous Daily High | 1.2806 |
| Previous Daily Low | 1.2680 |
| Previous Weekly High | 1.2996 |
| Previous Weekly Low | 1.2763 |
| Previous Monthly High | 1.3142 |
| Previous Monthly Low | 1.2659 |
| Daily Fibonacci 38.2% | 1.2728 |
| Daily Fibonacci 61.8% | 1.2758 |
| Daily Pivot Point S1 | 1.2659 |
| Daily Pivot Point S2 | 1.2607 |
| Daily Pivot Point S3 | 1.2534 |
| Daily Pivot Point R1 | 1.2785 |
| Daily Pivot Point R2 | 1.2858 |
| Daily Pivot Point R3 | 1.2910 |
[/s2If]
Download Nehcap EAWe have two EAs that are operational on our LIVE accounts.
- EA-FIX: Check out the details here. Download EA-FIX . EA-FIX is a non-grid HFT scalper.
- EA-GROWTH: High quality low dd EA using trend grids. Download EA_GROWTHJoin Our Telegram Group
")


