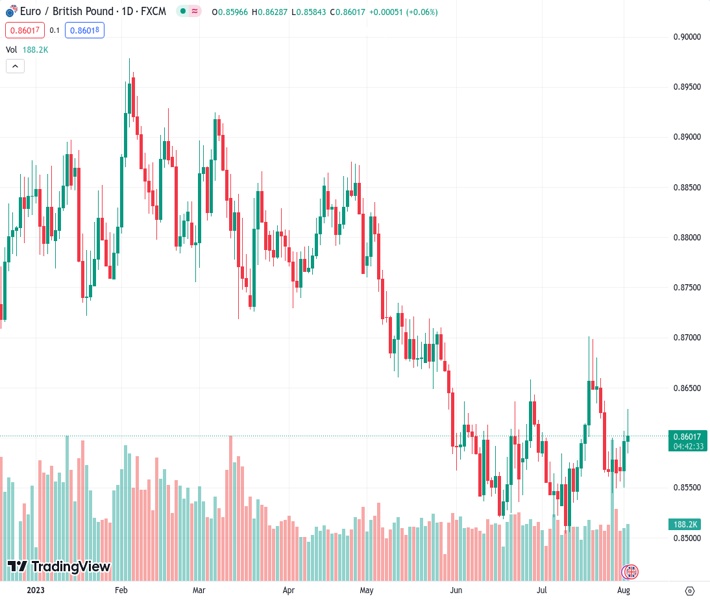
The EURGBP pair, currently at 0.86018, is still maintaining a neutral to downward outlook. It is facing significant resistance around the 0.8650/75 level, which could impede buyers from pushing the price towards 0.8700.
…
This is a premium post.
[s2If !current_user_can(access_s2member_level4)]Please register for FREE REGISTER to read full post below containing analysis. In case of any error or you think you are not able to read the full post below, please email us at support#nehcap.com [lwa][/s2If] [s2If current_user_can(access_s2member_level1)]
- EUR/GBP remains neutral to downward biased, with strong resistance at around 0.8650/75, potentially hindering buyers’ attempts to reach 0.8700.
The pair currently trades last at 0.86018.
The previous day high was 0.8607 while the previous day low was 0.855. The daily 38.2% Fib levels comes at 0.8585, expected to provide support. Similarly, the daily 61.8% fib level is at 0.8572, expected to provide support.
The EUR/GBP extends its gains to two consecutive days but faces solid resistance at around 0.8630, with the EUR/GBP pair dropping below the 50-day Exponential Moving Average (EMA) at 0.8609. At the time of writing, the EUR/GBP exchanges hands at 0.8607, gaining 0.12% after reaching a low of 0.8584.
The EUR/GBP daily chart portrays the pair as neutral to downward biased, despite the recent lower low being above the year-to-date (YTD) low of 0.8504 at 0.8544 but strong resistance at 0.8650/75, which could cap buyers’ attempts to reach the 0.8700 figure in the near term.
If EUR/GBP breaks above 0.8675, the next supply zone would be 0.8700. A breach of the latter will expose a seven-month-old downslope resistance trendline at around 0.8730/50, followed by a rally to 0.8800.
On the other hand, if EUR/GBP prints a daily close below the 50-day EMA at 0.8609, that could open the door for a break below the 0.8600 mark. The following support would be the 20-day EMA at 0.8689, followed by the last week’s low of 0.8544, ahead of the YTD low of 0.8504.
Oscillator-wise, the Relative Strength Index (RSI) turned bullish, while the three-day Rate of Change (RoC) suggests buyers are entering the market. However, they must reclaim solid resistance levels if they would like to extend their gains toward the 0.8700 figure.
Technical Levels: Supports and Resistances
EURGBP currently trading at 0.8605 at the time of writing. Pair opened at 0.8598 and is trading with a change of 0.08 % .
| Overview | Overview.1 | |
|---|---|---|
| 0 | Today last price | 0.8605 |
| 1 | Today Daily Change | 0.0007 |
| 2 | Today Daily Change % | 0.0800 |
| 3 | Today daily open | 0.8598 |
The pair is trading above its 20 Daily moving average @ 0.8582, above its 50 Daily moving average @ 0.8592 , below its 100 Daily moving average @ 0.8683 and below its 200 Daily moving average @ 0.8725
| Trends | Trends.1 | |
|---|---|---|
| 0 | Daily SMA20 | 0.8582 |
| 1 | Daily SMA50 | 0.8592 |
| 2 | Daily SMA100 | 0.8683 |
| 3 | Daily SMA200 | 0.8725 |
The previous day high was 0.8607 while the previous day low was 0.855. The daily 38.2% Fib levels comes at 0.8585, expected to provide support. Similarly, the daily 61.8% fib level is at 0.8572, expected to provide support.
Note the levels of interest below:
- Pivot support is noted at 0.8563, 0.8529, 0.8507
- Pivot resistance is noted at 0.8619, 0.8641, 0.8676
| Levels | Levels.1 |
|---|---|
| Previous Daily High | 0.8607 |
| Previous Daily Low | 0.8550 |
| Previous Weekly High | 0.8663 |
| Previous Weekly Low | 0.8544 |
| Previous Monthly High | 0.8701 |
| Previous Monthly Low | 0.8504 |
| Daily Fibonacci 38.2% | 0.8585 |
| Daily Fibonacci 61.8% | 0.8572 |
| Daily Pivot Point S1 | 0.8563 |
| Daily Pivot Point S2 | 0.8529 |
| Daily Pivot Point S3 | 0.8507 |
| Daily Pivot Point R1 | 0.8619 |
| Daily Pivot Point R2 | 0.8641 |
| Daily Pivot Point R3 | 0.8676 |
[/s2If]
Download Nehcap EAWe have two EAs that are operational on our LIVE accounts.
- EA-FIX: Check out the details here. Download EA-FIX . EA-FIX is a non-grid HFT scalper.
- EA-GROWTH: High quality low dd EA using trend grids. Download EA_GROWTHJoin Our Telegram Group
")


