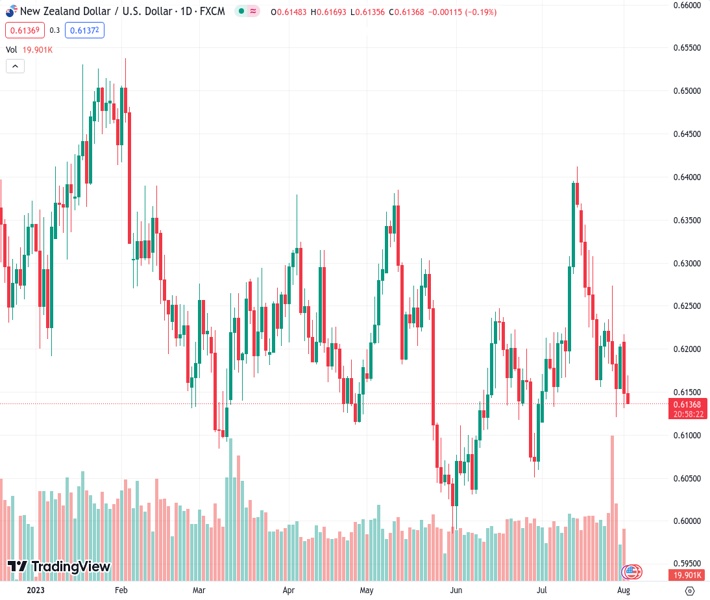
The NZDUSD currency pair, trading at a rate of 0.61394, is drawing in some individuals looking to sell. It is currently being traded at approximately 0.6142, experiencing a decrease of 0.12% over the course of the day.
…
This is a premium post.
[s2If !current_user_can(access_s2member_level4)]Please register for FREE REGISTER to read full post below containing analysis. In case of any error or you think you are not able to read the full post below, please email us at support#nehcap.com [lwa][/s2If] [s2If current_user_can(access_s2member_level1)]
- NZD/USD attracts some sellers, currently trades around 0.6142, losing 0.12% for the day.
The pair currently trades last at 0.61394.
The previous day high was 0.6226 while the previous day low was 0.6149. The daily 38.2% Fib levels comes at 0.6197, expected to provide resistance. Similarly, the daily 61.8% fib level is at 0.6178, expected to provide resistance.
The NZD/USD pair extends its downside and edges lower to the 0.6140 mark during the early Asian session on Wednesday. The pair faces some pressure following the New Zealand employment data for Q2 and the headlines surrounding the US rating cut.
On Tuesday, Fitch downgraded the United States government’s credit rating from AAA to AA+. The leading rating company cites an expected fiscal deterioration over the next three years and a high general government debt burden as the primary reasons for this drastic action. US Treasury Secretary Janet Yellen expressed her strong disagreement with Fitch’s decision to downgrade the US government’s credit rating, calling it “arbitrary and based on outdated data”, according to Reuters.
Market participants turn cautious and remain focused on the US rating cut headline. This report fuels concern about the US debt ceiling crisis and might exert pressure on the US Dollar.
On Tuesday, the US Bureau of Labour Statistics (BLS) reported that JOLTS Job Openings came in at 9.58 million in June. This reading followed May’s 9.82 million openings and was below the market consensus of 9.62 million. Meanwhile, the ISM Manufacturing PMI increased to 46.4 from 46 in July but was below the expectation of 46.8.
The latest data from Statistics New Zealand revealed that the New Zealand Unemployment Rate for Q2 came in at 3.6%, above the consensus of 3.5% and 3.4% prior. Employment Change QoQ rose 1.0%, better than expected at 0.5% and 0.8% previously. Additionally, the Labour Cost Index QoQ declined to 1.1% versus 1.2% forecast and 0.9% prior. The participation rate in Q2 improved to 72.4%, against an estimation of 72.0%. Following the mixed New Zealand data released, the Kiwi faces some follow-through selling and drops to 0.6140.
In the absence of top-tier economic data released from New Zealand later this week, market participants will shift their focus to the US ADP employment data due later in the day. Also, the US ISM Service PMI and Nonfarm Payrolls will be released on Thursday and Friday, respectively. These events could significantly impact the US Dollar’s dynamic and give the NZD/USD pair a clear direction.
Technical Levels: Supports and Resistances
NZDUSD currently trading at 0.6142 at the time of writing. Pair opened at 0.6209 and is trading with a change of -1.08 % .
| Overview | Overview.1 | |
|---|---|---|
| 0 | Today last price | 0.6142 |
| 1 | Today Daily Change | -0.0067 |
| 2 | Today Daily Change % | -1.0800 |
| 3 | Today daily open | 0.6209 |
The pair remains strongly bearish on the daily time frame. It trades below the 20 SMA @ 0.6232, 50 SMA 0.6166, 100 SMA @ 0.6198 and 200 SMA @ 0.6222.
| Trends | Trends.1 | |
|---|---|---|
| 0 | Daily SMA20 | 0.6232 |
| 1 | Daily SMA50 | 0.6166 |
| 2 | Daily SMA100 | 0.6198 |
| 3 | Daily SMA200 | 0.6222 |
The previous day high was 0.6226 while the previous day low was 0.6149. The daily 38.2% Fib levels comes at 0.6197, expected to provide resistance. Similarly, the daily 61.8% fib level is at 0.6178, expected to provide resistance.
Note the levels of interest below:
- Pivot support is noted at 0.6163, 0.6118, 0.6086
- Pivot resistance is noted at 0.624, 0.6272, 0.6317
| Levels | Levels.1 |
|---|---|
| Previous Daily High | 0.6226 |
| Previous Daily Low | 0.6149 |
| Previous Weekly High | 0.6274 |
| Previous Weekly Low | 0.6120 |
| Previous Monthly High | 0.6413 |
| Previous Monthly Low | 0.6120 |
| Daily Fibonacci 38.2% | 0.6197 |
| Daily Fibonacci 61.8% | 0.6178 |
| Daily Pivot Point S1 | 0.6163 |
| Daily Pivot Point S2 | 0.6118 |
| Daily Pivot Point S3 | 0.6086 |
| Daily Pivot Point R1 | 0.6240 |
| Daily Pivot Point R2 | 0.6272 |
| Daily Pivot Point R3 | 0.6317 |
[/s2If]
Download Nehcap EAWe have two EAs that are operational on our LIVE accounts.
- EA-FIX: Check out the details here. Download EA-FIX . EA-FIX is a non-grid HFT scalper.
- EA-GROWTH: High quality low dd EA using trend grids. Download EA_GROWTHJoin Our Telegram Group


