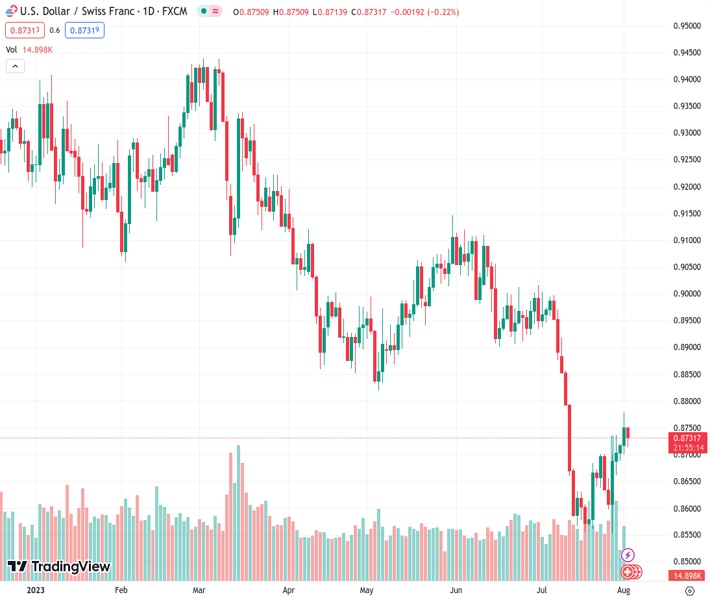
The USDCHF pair, trading at 0.87317, experiences a decrease in momentum near the 0.8730 level, resulting in a 0.24% decline during the early Asian trading session.
…
This is a premium post.
[s2If !current_user_can(access_s2member_level4)]Please register for FREE REGISTER to read full post below containing analysis. In case of any error or you think you are not able to read the full post below, please email us at support#nehcap.com [lwa][/s2If] [s2If current_user_can(access_s2member_level1)]
- USD/CHF loses momentum around 0.8730, down 0.24% in the early Asian trading hours.
The pair currently trades last at 0.87317.
The previous day high was 0.873 while the previous day low was 0.8665. The daily 38.2% Fib levels comes at 0.8705, expected to provide support. Similarly, the daily 61.8% fib level is at 0.869, expected to provide support.
The USD/CHF pair snaps a four-day winning streak near 0.8730 during the early Asian session on Wednesday. Market participants await the US ADP employment report due in the American session for some hints for Friday’s Nonfarm Payrolls. Meanwhile, the US Dollar Index (DXY), a measure of the value of the Greenback against six other major currencies, loses momentum to 101.95 after retreating from the 102.45 mark.
On Tuesday, the US Bureau of Labour Statistics (BLS) reported that JOLTS Job Openings came in at 9.58 million in June. This reading followed May’s 9.82 million openings and was below the market consensus of 9.62 million. Meanwhile, the ISM Manufacturing PMI increased to 46.4 from 46 in July, but was below the expectation of 46.8.
The renewed trade war tensions between the US-China might undermine the US Dollar and act as a headwind for the USD/CHF pair. China’s authorities announced export restrictions on some drones and drone-related equipment to the US on Monday, citing “national security and interests”. The restriction will go into effect on September 1, according to the commerce ministry. It’s worth noting that the US is China’s biggest export market for drones.
Additionally, US President Joe Biden plans to sign an executive order curbing US technology investments in China by mid-August. Investors will keep an eye on the developments surrounding the US-China relationship. The tension between the world’s two largest economies could benefit the traditional safe-haven Swiss Franc (CHF) and cap the upside for USD/CHF.
About the data, the Swiss ZEW Survey Expectations data by the Centre for European Economic Research reported that the figure came in at -32.6 versus -30.8 prior and a worse-than-expected 31.1. While Swiss Retail Sales for June YoY came in at 1.8% versus a 0.9% decline in May.
Moving on, the Swiss SECO Consumer Climate, Manufacturing PMI, and Consumer Price Index (CPI) y/y could offer clues about the Swiss franc’s movement. Market players will also monitor the release of the US ADP employment report later in the day ahead of the US ISM Service PMI and Nonfarm Payrolls. Traders will take cues from the data and find opportunities around the USD/CHF pair.
Technical Levels: Supports and Resistances
USDCHF currently trading at 0.8736 at the time of writing. Pair opened at 0.8719 and is trading with a change of 0.19 % .
| Overview | Overview.1 | |
|---|---|---|
| 0 | Today last price | 0.8736 |
| 1 | Today Daily Change | 0.0017 |
| 2 | Today Daily Change % | 0.1900 |
| 3 | Today daily open | 0.8719 |
The pair is trading above its 20 Daily moving average @ 0.8724, below its 50 Daily moving average @ 0.8897 , below its 100 Daily moving average @ 0.8964 and below its 200 Daily moving average @ 0.9179
| Trends | Trends.1 | |
|---|---|---|
| 0 | Daily SMA20 | 0.8724 |
| 1 | Daily SMA50 | 0.8897 |
| 2 | Daily SMA100 | 0.8964 |
| 3 | Daily SMA200 | 0.9179 |
The previous day high was 0.873 while the previous day low was 0.8665. The daily 38.2% Fib levels comes at 0.8705, expected to provide support. Similarly, the daily 61.8% fib level is at 0.869, expected to provide support.
Note the levels of interest below:
- Pivot support is noted at 0.8679, 0.864, 0.8615
- Pivot resistance is noted at 0.8744, 0.8769, 0.8808
| Levels | Levels.1 |
|---|---|
| Previous Daily High | 0.8730 |
| Previous Daily Low | 0.8665 |
| Previous Weekly High | 0.8737 |
| Previous Weekly Low | 0.8552 |
| Previous Monthly High | 0.9005 |
| Previous Monthly Low | 0.8552 |
| Daily Fibonacci 38.2% | 0.8705 |
| Daily Fibonacci 61.8% | 0.8690 |
| Daily Pivot Point S1 | 0.8679 |
| Daily Pivot Point S2 | 0.8640 |
| Daily Pivot Point S3 | 0.8615 |
| Daily Pivot Point R1 | 0.8744 |
| Daily Pivot Point R2 | 0.8769 |
| Daily Pivot Point R3 | 0.8808 |
[/s2If]
Download Nehcap EAWe have two EAs that are operational on our LIVE accounts.
- EA-FIX: Check out the details here. Download EA-FIX . EA-FIX is a non-grid HFT scalper.
- EA-GROWTH: High quality low dd EA using trend grids. Download EA_GROWTHJoin Our Telegram Group


