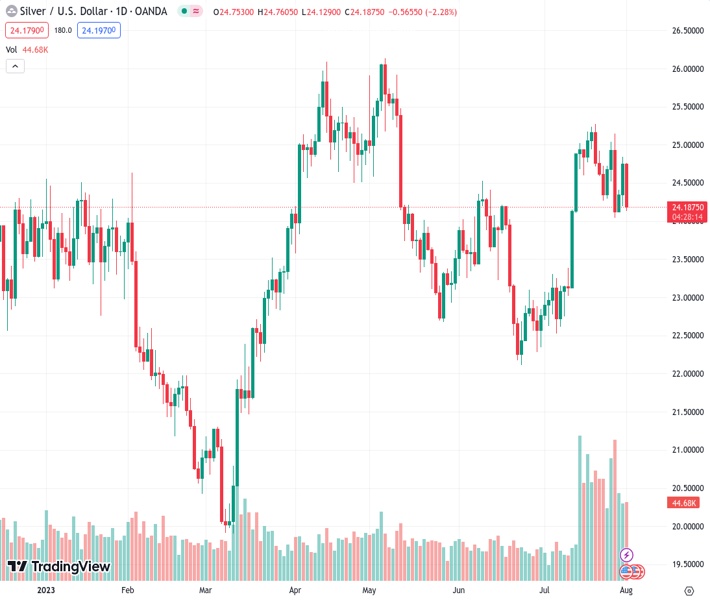
The XAGUSD currency pair declined by over 1%, falling towards the $24.20 region, but it remains above the 20-day Simple Moving Average (SMA).
…
This is a premium post.
[s2If !current_user_can(access_s2member_level4)]Please register for FREE REGISTER to read full post below containing analysis. In case of any error or you think you are not able to read the full post below, please email us at support#nehcap.com [lwa][/s2If] [s2If current_user_can(access_s2member_level1)]
- XAG/USD retreated more than 1% towards the $24.20 area, still holding the 20-day SMA.
The pair currently trades last at 24.185.
The previous day high was 24.84 while the previous day low was 24.2. The daily 38.2% Fib levels comes at 24.59, expected to provide resistance. Similarly, the daily 61.8% fib level is at 24.44, expected to provide resistance.
On Tuesday, the XAG/USD Silver spot price significantly dropped, mainly due to the USD strength. Attention is on labour market data released as investors are modelling their expectations towards the next Federal Reserve (Fed) meeting. Meanwhile, the greenback trades strong agains most of its rivals, with the USD DXY index rising towards the 102.30 area.
The US ISM July PMI came in slightly below expectations at 46.4 but higher than the previous reading of 46. JOLT’s Job Openings missed expectations at 9.58M below the 9.62M. Its worth pointing out that Fed Chairman Powell stated that the economy holds resilient, but future decisions depend on incoming data, causing potential volatility in USD price dynamics on data releases. In that sense ADP job employment change, Jobless Claims, and Nonfarm Payrolls will be closely monitored this week for investors to start placing their bets on the next Fed meetings.
In the meantime, US yields are rising, which could be seen as the opportunity cost of holding non-yielding metals, are rising across the board. The 2-year yield remains steady at 4.88% while the 5 and 10 rates are at 4.22% and 4.02%, respectively, increasing more than 1%. In addition, the CME FedWatch tool indicates that investors are not so confident about a hike in September as their odds stand near 20% while the probabilities in November top out near 40%.
As per the daily chart, the technical outlook for XAG/USD is shifting towards neutral to bearish, with signs of bullish exhaustion becoming evident. The Relative Strength Index (RSI) displays a negative slope above its midline, while the Moving Average Convergence Divergence (MACD) exhibits fading green bars. Furthermore, the pair is above the 20,100,200-day SMAs, suggesting that the bulls are firmly in control of the bigger picture.
Resistance levels: $24.90,$25.00, $25.30.
Support levels: $24.15 (20-day SMA), $24.00, $23.80
Technical Levels: Supports and Resistances
XAGUSD currently trading at 24.17 at the time of writing. Pair opened at 24.76 and is trading with a change of -2.38 % .
| Overview | Overview.1 | |
|---|---|---|
| 0 | Today last price | 24.17 |
| 1 | Today Daily Change | -0.59 |
| 2 | Today Daily Change % | -2.38 |
| 3 | Today daily open | 24.76 |
The pair is trading below its 20 Daily moving average @ 24.19, above its 50 Daily moving average @ 23.67 , above its 100 Daily moving average @ 23.97 and above its 200 Daily moving average @ 23.08
| Trends | Trends.1 | |
|---|---|---|
| 0 | Daily SMA20 | 24.19 |
| 1 | Daily SMA50 | 23.67 |
| 2 | Daily SMA100 | 23.97 |
| 3 | Daily SMA200 | 23.08 |
The previous day high was 24.84 while the previous day low was 24.2. The daily 38.2% Fib levels comes at 24.59, expected to provide resistance. Similarly, the daily 61.8% fib level is at 24.44, expected to provide resistance.
Note the levels of interest below:
- Pivot support is noted at 24.35, 23.96, 23.71
- Pivot resistance is noted at 25.0, 25.24, 25.64
| Levels | Levels.1 |
|---|---|
| Previous Daily High | 24.84 |
| Previous Daily Low | 24.20 |
| Previous Weekly High | 25.15 |
| Previous Weekly Low | 24.04 |
| Previous Monthly High | 25.27 |
| Previous Monthly Low | 22.52 |
| Daily Fibonacci 38.2% | 24.59 |
| Daily Fibonacci 61.8% | 24.44 |
| Daily Pivot Point S1 | 24.35 |
| Daily Pivot Point S2 | 23.96 |
| Daily Pivot Point S3 | 23.71 |
| Daily Pivot Point R1 | 25.00 |
| Daily Pivot Point R2 | 25.24 |
| Daily Pivot Point R3 | 25.64 |
[/s2If]
Download Nehcap EAWe have two EAs that are operational on our LIVE accounts.
- EA-FIX: Check out the details here. Download EA-FIX . EA-FIX is a non-grid HFT scalper.
- EA-GROWTH: High quality low dd EA using trend grids. Download EA_GROWTHJoin Our Telegram Group


