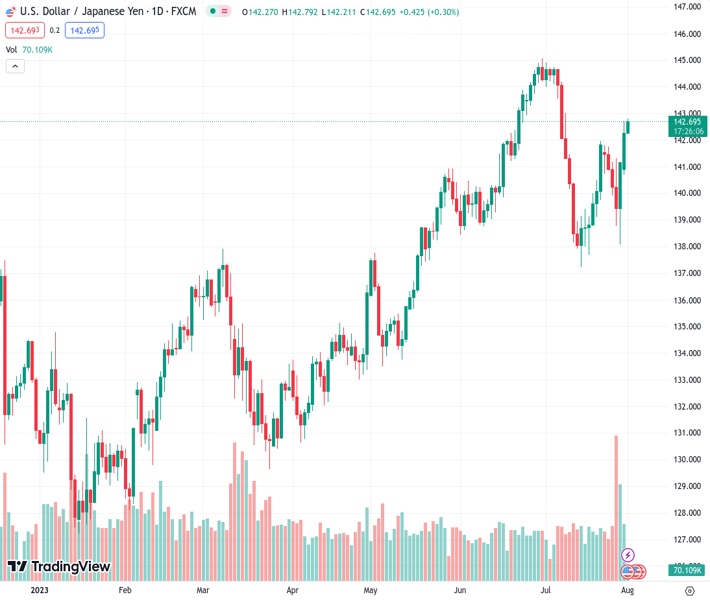
#USDJPY @ 142.655 scales higher for the third successive day and climbs to a fresh three-week high.
…
This is a premium post.
[s2If !current_user_can(access_s2member_level4)]Please register for FREE REGISTER to read full post below containing analysis. In case of any error or you think you are not able to read the full post below, please email us at support#nehcap.com [lwa][/s2If] [s2If current_user_can(access_s2member_level1)]
- USD/JPY scales higher for the third successive day and climbs to a fresh three-week high.
The pair currently trades last at 142.655.
The previous day high was 142.7 while the previous day low was 140.69. The daily 38.2% Fib levels comes at 141.93, expected to provide support. Similarly, the daily 61.8% fib level is at 141.46, expected to provide support.
The USD/JPY pair builds on its solid recovery from the 138.00 mark touched in the aftermath of the Bank of Japan’s (BoJ) policy tweak and gains some follow-through traction for the third successive day on Tuesday. The momentum lifts spot prices to a fresh three-week high, around the 142.80 region during the Asian session and is sponsored by a combination of factors.
The Bank of Japan’s unscheduled operation on Monday to buy ¥300 billion ($2 billion) worth of Japanese government bonds (JGB) for the first time since February 2022 continues to weigh on the Japanese Yen (JPY). The US Dollar (USD), on the other hand, climbs to its highest level since July 10 and remains well supported by expectations for one more 25 bps rate hike by the Federal Reserve (Fed) in September or November. This, in turn, is seen as a key factor acting as a tailwind for the USD/JPY pair.
From a technical perspective, the overnight breakthrough a resistance marked by the 200-period Simple Moving Average (SMA) on the 4-hour chart and a daily close above the 142.00 round figure was seen as a fresh trigger for bullish traders. A subsequent strength beyond the 61.8% Fibonacci retracement level of the June-July downfall – from levels just above the 145.00 psychological mark – validates the constructive setup and supports prospects for a further appreciating move for the USD/JPY pair.
Hence, some follow-through positive move beyond the 143.00 round-figure mark, towards testing the next relevant hurdle near the 143.50-143.55 horizontal zone, looks like a distinct possibility. The upward trajectory could get extended further towards reclaiming the 144.00 mark, also representing a strong support breakpoint, now turned resistance.
On the flip side, the Asian session low, around the 142.20 area, now seems to protect the immediate downside ahead of the 142.00 mark or the 61.8% Fibo. level. This is followed by the 200-period SMA on the 4-hour chart, currently around the 141.70 region, which should now act as a pivotal point for the USD/JPY pair. A convincing break below should pave the way for further gains and lift spot prices back towards the 50% Fibo. level, around the 141.20 region, en route to the 141.00 round figure.
Any further decline is more likely to attract some buyers and remain limited near the 140.30-140.25 region, or the 38.2% Fibo. level. This is followed by the 140.00 psychological mark, which if broken decisively will shift the bias in favour of bearish traders. The downward trajectory could then get extended and drag the USD/JPY pair further towards the 23.6% Fibo. level, around the 139.10-139.00 region.
Technical Levels: Supports and Resistances
USDJPY currently trading at 142.67 at the time of writing. Pair opened at 142.29 and is trading with a change of 0.27 % .
| Overview | Overview.1 | |
|---|---|---|
| 0 | Today last price | 142.67 |
| 1 | Today Daily Change | 0.38 |
| 2 | Today Daily Change % | 0.27 |
| 3 | Today daily open | 142.29 |
The pair remains strongly bullish on the daily timeframe. It trades above its 20 SMA @ 140.85, 50 SMA 141.04, 100 SMA @ 137.51 and 200 SMA @ 136.67.
| Trends | Trends.1 | |
|---|---|---|
| 0 | Daily SMA20 | 140.85 |
| 1 | Daily SMA50 | 141.04 |
| 2 | Daily SMA100 | 137.51 |
| 3 | Daily SMA200 | 136.67 |
The previous day high was 142.7 while the previous day low was 140.69. The daily 38.2% Fib levels comes at 141.93, expected to provide support. Similarly, the daily 61.8% fib level is at 141.46, expected to provide support.
Note the levels of interest below:
- Pivot support is noted at 141.09, 139.89, 139.09
- Pivot resistance is noted at 143.1, 143.9, 145.1
| Levels | Levels.1 |
|---|---|
| Previous Daily High | 142.70 |
| Previous Daily Low | 140.69 |
| Previous Weekly High | 141.82 |
| Previous Weekly Low | 138.07 |
| Previous Monthly High | 144.91 |
| Previous Monthly Low | 137.24 |
| Daily Fibonacci 38.2% | 141.93 |
| Daily Fibonacci 61.8% | 141.46 |
| Daily Pivot Point S1 | 141.09 |
| Daily Pivot Point S2 | 139.89 |
| Daily Pivot Point S3 | 139.09 |
| Daily Pivot Point R1 | 143.10 |
| Daily Pivot Point R2 | 143.90 |
| Daily Pivot Point R3 | 145.10 |
[/s2If]
Download Nehcap EAWe have two EAs that are operational on our LIVE accounts.
- EA-FIX: Check out the details here. Download EA-FIX . EA-FIX is a non-grid HFT scalper.
- EA-GROWTH: High quality low dd EA using trend grids. Download EA_GROWTHJoin Our Telegram Group


