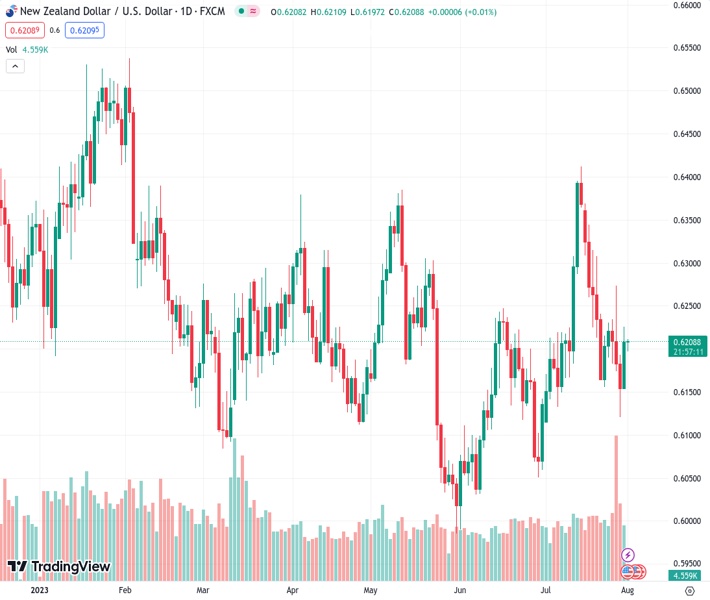
The NZDUSD pair has increased further above the important level of 0.6200, building upon the gains it made on Monday.
…
This is a premium post.
[s2If !current_user_can(access_s2member_level4)]Please register for FREE REGISTER to read full post below containing analysis. In case of any error or you think you are not able to read the full post below, please email us at support#nehcap.com [lwa][/s2If] [s2If current_user_can(access_s2member_level1)]
- NZD/USD adds to Monday’s gains above the 0.6200 key barrier.
The pair currently trades last at 0.62092.
The previous day high was 0.6195 while the previous day low was 0.612. The daily 38.2% Fib levels comes at 0.6149, expected to provide support. Similarly, the daily 61.8% fib level is at 0.6166, expected to provide support.
The NZD/USD pair trades on a positive note and extends its upside above the 0.6200 mark in the early Asian session. The pair currently trades around 0.6210, gaining 0.02% for the day. Market players await the New Zealand employment data on Wednesday for fresh impetus.
Meanwhile, the US Dollar Index (DXY), a measure of the value of the Greenback against a basket of six major currencies, consolidates near 101.85 following last week’s gains against major rivals.
The United States published low-tier economic figures on Monday. The US Chicago Purchasing Managers Index (PMI) for July came in at 42.8 from 41.5 in June, versus 43 expected, while the Dallas Manufacturing Index edged higher to -20 in July from -23.2 in June.
Additionally, the annual US inflation data showed last week that the figure grew at its slowest pace in over two years. The US Bureau of Economic Analysis reported the Personal Consumption Expenditures (PCE) Price Index fell from 3.8% in May to 3% in June, below the market expectation of 3.1%. While the Federal Reserve’s preferred measure of inflation, the Core PCE Price Index, came in at 4.1% annually, down from 4.6% in May and below market expectations of 4.2%. The softer data indicates pricing pressures are easing and may bring the Federal Reserve (Fed) closer to the end of its hiking cycle. This, in turn, might cap the upside in the US Dollar and act as a tailwind for NZD/USD.
On the other hand, Statistics New Zealand revealed on Tuesday that Building Permits in June were up 3.5% MoM after a 2.23% decline in May. Earlier this week, the National Bank of New Zealand showed that July’s New Zealand ANZ Activity Outlook improved to 0.8%, above the expected 0.9% decline. Meanwhile, ANZ Business Confidence fell from -18 in June to -13.1 in July.
Looking ahead, New Zealand will release employment data on Wednesday. On the US docket, The US Bureau of Labour Statistics will release JOLTS Job Openings numbers on Tuesday, followed by ADP private sector employment on Wednesday and Nonfarm Payrolls on Friday. The economy is expected to have created 180,000 jobs. These events could significantly impact the US Dollar’s dynamic and give the NZD/USD pair a clear direction.
Technical Levels: Supports and Resistances
NZDUSD currently trading at 0.6209 at the time of writing. Pair opened at 0.615 and is trading with a change of 0.96 % .
| Overview | Overview.1 | |
|---|---|---|
| 0 | Today last price | 0.6209 |
| 1 | Today Daily Change | 0.0059 |
| 2 | Today Daily Change % | 0.9600 |
| 3 | Today daily open | 0.6150 |
The pair is trading below its 20 Daily moving average @ 0.6229, above its 50 Daily moving average @ 0.6168 , above its 100 Daily moving average @ 0.6198 and below its 200 Daily moving average @ 0.6219
| Trends | Trends.1 | |
|---|---|---|
| 0 | Daily SMA20 | 0.6229 |
| 1 | Daily SMA50 | 0.6168 |
| 2 | Daily SMA100 | 0.6198 |
| 3 | Daily SMA200 | 0.6219 |
The previous day high was 0.6195 while the previous day low was 0.612. The daily 38.2% Fib levels comes at 0.6149, expected to provide support. Similarly, the daily 61.8% fib level is at 0.6166, expected to provide support.
Note the levels of interest below:
- Pivot support is noted at 0.6115, 0.608, 0.604
- Pivot resistance is noted at 0.619, 0.623, 0.6265
| Levels | Levels.1 |
|---|---|
| Previous Daily High | 0.6195 |
| Previous Daily Low | 0.6120 |
| Previous Weekly High | 0.6274 |
| Previous Weekly Low | 0.6120 |
| Previous Monthly High | 0.6250 |
| Previous Monthly Low | 0.5990 |
| Daily Fibonacci 38.2% | 0.6149 |
| Daily Fibonacci 61.8% | 0.6166 |
| Daily Pivot Point S1 | 0.6115 |
| Daily Pivot Point S2 | 0.6080 |
| Daily Pivot Point S3 | 0.6040 |
| Daily Pivot Point R1 | 0.6190 |
| Daily Pivot Point R2 | 0.6230 |
| Daily Pivot Point R3 | 0.6265 |
[/s2If]
Download Nehcap EAWe have two EAs that are operational on our LIVE accounts.
- EA-FIX: Check out the details here. Download EA-FIX . EA-FIX is a non-grid HFT scalper.
- EA-GROWTH: High quality low dd EA using trend grids. Download EA_GROWTHJoin Our Telegram Group
")


