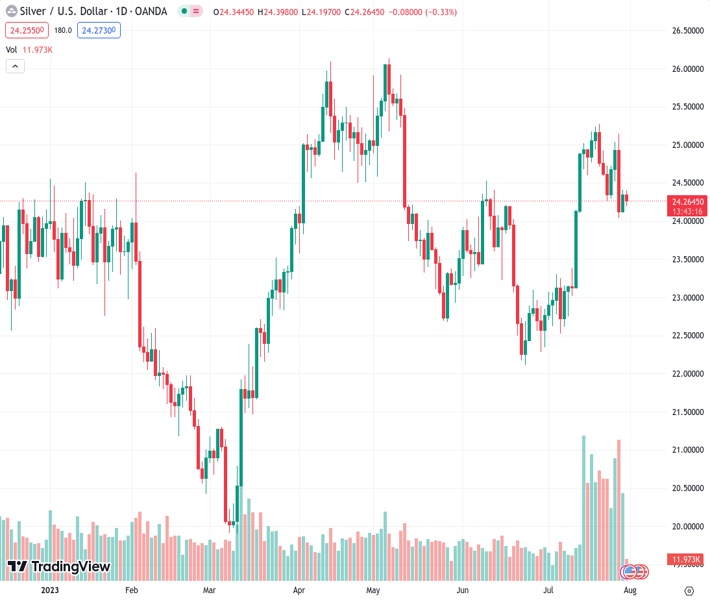
There is renewed selling pressure on silver, causing it to reverse some of the gains it made on Friday.
…
This is a premium post.
[s2If !current_user_can(access_s2member_level4)]Please register for FREE REGISTER to read full post below containing analysis. In case of any error or you think you are not able to read the full post below, please email us at support#nehcap.com [lwa][/s2If] [s2If current_user_can(access_s2member_level1)]
- Silver comes under fresh selling pressure and reverses a part of Friday’s modest recovery gains.
The pair currently trades last at 24.251.
The previous day high was 24.41 while the previous day low was 24.09. The daily 38.2% Fib levels comes at 24.29, expected to provide resistance. Similarly, the daily 61.8% fib level is at 24.21, expected to provide support.
Silver meets with a fresh supply on the first day of a new week and erodes a part of Friday’s modest recovery gains from the vicinity of the $24.00 mark, or over a two-week low. The white metal maintains its offered tone through the early European session and currently trades around the $24.25 region, down nearly 0.50% for the day.
From a technical perspective, last week’s failure ahead of the $25.00 psychological mark and the subsequent slump below the $24.30-$24.25 resistance-turned-support was seen as a fresh trigger for bearish traders. This, along with the emergence of fresh selling on Monday and negative oscillators on hourly charts suggest that the path of least resistance for the XAG/USD is to the downside.
That said, technical indicators on the daily chart – though have been losing traction – are yet to confirm the negative outlook. This makes it prudent to wait for a sustained break below the $24.00 mark before positioning for deeper losses. The XAG/USD might then turn vulnerable and accelerate the downfall towards testing the next relevant support near the $23.20-$23.15 area en route to the $23.00 mark.
The latter coincides with the very important 200-day Simple Moving Average (SMA), which if broken decisively should pave the way for a fall towards challenging the multi-month low, around the $22.15-$22.10 area touched in June.
On the flip side, the $24.30-$24.35 region might continue to act as an immediate hurdle ahead of the $24.60-$24.65 area. Some follow-through buying could lift the XAG/USD back to the $25.00 mark. This is followed by the monthly peak, around the $25.25 zone, which if cleared will negate the negative outlook. Silver might then surpass the $25.50-$25.55 hurdle and aim to reclaim the $26.00 mark.
Technical Levels: Supports and Resistances
XAGUSD currently trading at 24.25 at the time of writing. Pair opened at 24.35 and is trading with a change of -0.41 % .
| Overview | Overview.1 | |
|---|---|---|
| 0 | Today last price | 24.25 |
| 1 | Today Daily Change | -0.10 |
| 2 | Today Daily Change % | -0.41 |
| 3 | Today daily open | 24.35 |
The pair remains strongly bullish on the daily timeframe. It trades above its 20 SMA @ 24.09, 50 SMA 23.65, 100 SMA @ 23.93 and 200 SMA @ 23.06.
| Trends | Trends.1 | |
|---|---|---|
| 0 | Daily SMA20 | 24.09 |
| 1 | Daily SMA50 | 23.65 |
| 2 | Daily SMA100 | 23.93 |
| 3 | Daily SMA200 | 23.06 |
The previous day high was 24.41 while the previous day low was 24.09. The daily 38.2% Fib levels comes at 24.29, expected to provide resistance. Similarly, the daily 61.8% fib level is at 24.21, expected to provide support.
Note the levels of interest below:
- Pivot support is noted at 24.16, 23.97, 23.84
- Pivot resistance is noted at 24.48, 24.6, 24.79
| Levels | Levels.1 |
|---|---|
| Previous Daily High | 24.41 |
| Previous Daily Low | 24.09 |
| Previous Weekly High | 25.15 |
| Previous Weekly Low | 24.04 |
| Previous Monthly High | 24.53 |
| Previous Monthly Low | 22.11 |
| Daily Fibonacci 38.2% | 24.29 |
| Daily Fibonacci 61.8% | 24.21 |
| Daily Pivot Point S1 | 24.16 |
| Daily Pivot Point S2 | 23.97 |
| Daily Pivot Point S3 | 23.84 |
| Daily Pivot Point R1 | 24.48 |
| Daily Pivot Point R2 | 24.60 |
| Daily Pivot Point R3 | 24.79 |
[/s2If]
Download Nehcap EAWe have two EAs that are operational on our LIVE accounts.
- EA-FIX: Check out the details here. Download EA-FIX . EA-FIX is a non-grid HFT scalper.
- EA-GROWTH: High quality low dd EA using trend grids. Download EA_GROWTHJoin Our Telegram Group
")


