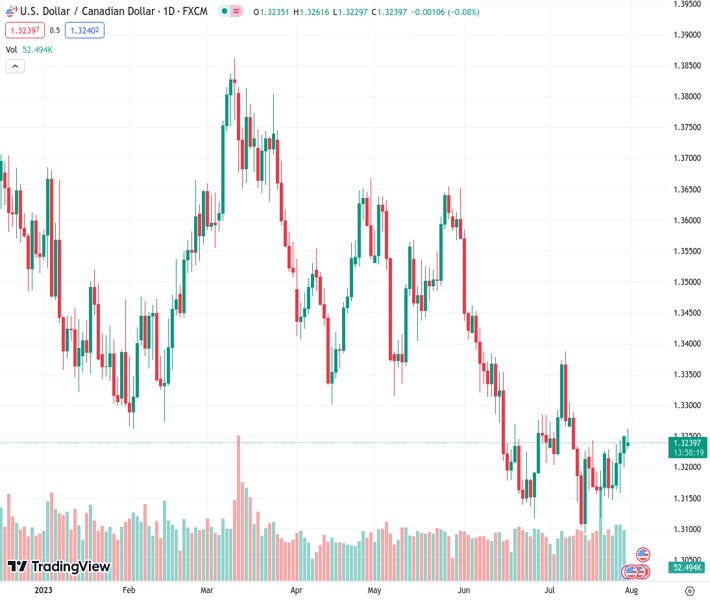
During the first decline in five days, the USDCAD currency pair is experiencing selling pressure, causing it to reach a new intraday low at a rate of 1.32377.
…
This is a premium post.
[s2If !current_user_can(access_s2member_level4)]Please register for FREE REGISTER to read full post below containing analysis. In case of any error or you think you are not able to read the full post below, please email us at support#nehcap.com [lwa][/s2If] [s2If current_user_can(access_s2member_level1)]
- USD/CAD takes offers to refresh intraday low during the first daily fall in five.
The pair currently trades last at 1.32377.
The previous day high was 1.3255 while the previous day low was 1.3201. The daily 38.2% Fib levels comes at 1.3234, expected to provide support. Similarly, the daily 61.8% fib level is at 1.3222, expected to provide support.
USD/CAD refreshes intraday low as it drops to 1.3230 heading into Monday’s European session. The Loonie pair’s latest weakness could be linked to the recovery in prices of Canada’s biggest export earner, namely WTI crude oil, as well as the US Dollar’s positioning for this week’s top-tier. Also, the market’s month-end consolidation and the Canadian Dollar’s (CAD), known as the Loonie, preparations ahead of Friday’s top-tier Canada employment report for July, add strength to the downside bias.
That said, WTI crude oil recovers from the intraday low of $79.95 to $80.25 by the press time as it prints the first daily loss in three. In doing so, the black gold cheers the hopes of more energy demand due to China’s stimulus, one of the world’s biggest Oil consumers. Also fueling the black gold’s price could be the hopes of Saudi Arabia’s extension of production cuts.
Elsewhere, Canadian GDP for June improved to 0.3% MoM on Friday, versus revised down figures of 0.1% prior, which in turn contrasts with downbeat US Core Personal Consumption Expenditure (PCE) Price Index for June to keep the USD/CAD bears hopeful. It’s worth noting that Federal Reserve Bank of Minneapolis President Neel Kashkari flagged fears of job losses and slower growth during the weekend interview, which in turn prod the Fed hawks and weigh on the Loonie pair prices.
It should be noted that upbeat prints of China’s official Manufacturing PMI for July and announcements of stimulus to conserve and boost consumer demand joined receding hawkish bets about the major central banks to let the markets be optimistic and weigh US Dollar.
Against this backdrop, US Dollar Index (DXY) licks its wounds near the three-week high of around 101.70-80 while S&P500 Futures stay lackluster at 4,605 after refreshing the yearly high the last week. That said, US Treasury bond yields edge higher by the press time.
Looking ahead, USD/CAD pair may witness further downside as traders prepare for the monthly employment data from the US and Canada. Also important are the US ISM Manufacturing and Services PMIs for July.
Failure to stabilize beyond a two-month-old resistance line, around 1.3245 by the press time, directs USD/CAD bears toward the 21-DMA support of around 1.3220.
Technical Levels: Supports and Resistances
USDCAD currently trading at 1.3235 at the time of writing. Pair opened at 1.3254 and is trading with a change of -0.14% % .
| Overview | Overview.1 | |
|---|---|---|
| 0 | Today last price | 1.3235 |
| 1 | Today Daily Change | -0.0019 |
| 2 | Today Daily Change % | -0.14% |
| 3 | Today daily open | 1.3254 |
The pair is trading above its 20 Daily moving average @ 1.3219, below its 50 Daily moving average @ 1.3305 , below its 100 Daily moving average @ 1.3423 and below its 200 Daily moving average @ 1.3463
| Trends | Trends.1 | |
|---|---|---|
| 0 | Daily SMA20 | 1.3219 |
| 1 | Daily SMA50 | 1.3305 |
| 2 | Daily SMA100 | 1.3423 |
| 3 | Daily SMA200 | 1.3463 |
The previous day high was 1.3255 while the previous day low was 1.3201. The daily 38.2% Fib levels comes at 1.3234, expected to provide support. Similarly, the daily 61.8% fib level is at 1.3222, expected to provide support.
Note the levels of interest below:
- Pivot support is noted at 1.3218, 1.3183, 1.3165
- Pivot resistance is noted at 1.3272, 1.329, 1.3326
| Levels | Levels.1 |
|---|---|
| Previous Daily High | 1.3255 |
| Previous Daily Low | 1.3201 |
| Previous Weekly High | 1.3255 |
| Previous Weekly Low | 1.3147 |
| Previous Monthly High | 1.3585 |
| Previous Monthly Low | 1.3117 |
| Daily Fibonacci 38.2% | 1.3234 |
| Daily Fibonacci 61.8% | 1.3222 |
| Daily Pivot Point S1 | 1.3218 |
| Daily Pivot Point S2 | 1.3183 |
| Daily Pivot Point S3 | 1.3165 |
| Daily Pivot Point R1 | 1.3272 |
| Daily Pivot Point R2 | 1.3290 |
| Daily Pivot Point R3 | 1.3326 |
[/s2If]
Download Nehcap EAWe have two EAs that are operational on our LIVE accounts.
- EA-FIX: Check out the details here. Download EA-FIX . EA-FIX is a non-grid HFT scalper.
- EA-GROWTH: High quality low dd EA using trend grids. Download EA_GROWTHJoin Our Telegram Group
")


