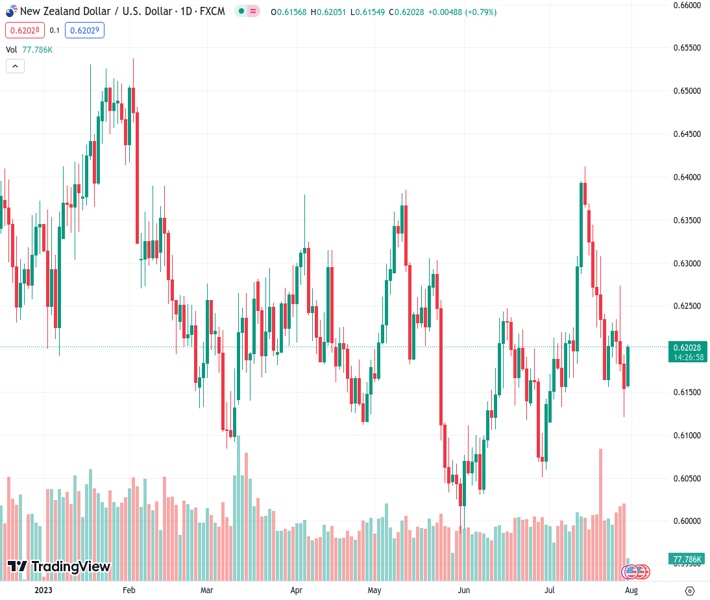
The NZDUSD pair is presently at a level of 0.62017 and has seen an increase in buying interest, causing it to reach its highest point of the day. This has resulted in its first daily gain in four days. However, the expectation is for only a minor improvement and not a significant recovery.
…
This is a premium post.
[s2If !current_user_can(access_s2member_level4)]Please register for FREE REGISTER to read full post below containing analysis. In case of any error or you think you are not able to read the full post below, please email us at support#nehcap.com [lwa][/s2If] [s2If current_user_can(access_s2member_level1)]
- NZD/USD takes the bids to refresh intraday high, prints the first daily gain in four.
The pair currently trades last at 0.62017.
The previous day high was 0.6195 while the previous day low was 0.612. The daily 38.2% Fib levels comes at 0.6149, expected to provide support. Similarly, the daily 61.8% fib level is at 0.6166, expected to provide support.
NZD/USD snaps a three-day downtrend as it extends late Friday’s rebound from a two-month-old ascending support line towards 0.6200 heading into Monday’s European session. In doing so, the Kiwi pair cheers upbeat sentiment data at home, as well as China stimulus, while teasing the bulls as markets await July’s employment data for New Zealand (NZ) and the US.
However, the bearish MACD signals join the near 50.0 levels of the RSI (14) line and the 200-Exponential Moving Average (EMA) surrounding 0.6220 to challenge the NZD/USD bulls.
Even if the quote crosses the 0.6220 hurdle, a downward-sloping resistance line from July 14, close to 0.6240 at the latest, can act as the final defense of the NZD/USD buyers, a break of which could quickly propel the quote past the 0.6300 round figure. The same highlights an upward-sloping resistance line from early February, near 0.6380 by the press time.
On the flip side, a daily closing below the three-month-old rising support line, surrounding 0.6130 at the latest, could drag the price toward the lows marked in June and March, near 0.6050 and 0.6085.
Should the NZD/USD remains bearish past 0.6050, multiple levels around 0.6030 and the 0.6000 round figure will be crucial for the bears to watch.
Overall, the Kiwi pair buyers flex their muscles but the bears are still in the driver’s seat.
Trend: Limited recovery expected
Technical Levels: Supports and Resistances
NZDUSD currently trading at 0.6196 at the time of writing. Pair opened at 0.615 and is trading with a change of 0.75% % .
| Overview | Overview.1 | |
|---|---|---|
| 0 | Today last price | 0.6196 |
| 1 | Today Daily Change | 0.0046 |
| 2 | Today Daily Change % | 0.75% |
| 3 | Today daily open | 0.615 |
The pair is trading below its 20 Daily moving average @ 0.6229, above its 50 Daily moving average @ 0.6168 , below its 100 Daily moving average @ 0.6198 and below its 200 Daily moving average @ 0.6219
| Trends | Trends.1 | |
|---|---|---|
| 0 | Daily SMA20 | 0.6229 |
| 1 | Daily SMA50 | 0.6168 |
| 2 | Daily SMA100 | 0.6198 |
| 3 | Daily SMA200 | 0.6219 |
The previous day high was 0.6195 while the previous day low was 0.612. The daily 38.2% Fib levels comes at 0.6149, expected to provide support. Similarly, the daily 61.8% fib level is at 0.6166, expected to provide support.
Note the levels of interest below:
- Pivot support is noted at 0.6115, 0.608, 0.604
- Pivot resistance is noted at 0.619, 0.623, 0.6265
| Levels | Levels.1 |
|---|---|
| Previous Daily High | 0.6195 |
| Previous Daily Low | 0.6120 |
| Previous Weekly High | 0.6274 |
| Previous Weekly Low | 0.6120 |
| Previous Monthly High | 0.6250 |
| Previous Monthly Low | 0.5990 |
| Daily Fibonacci 38.2% | 0.6149 |
| Daily Fibonacci 61.8% | 0.6166 |
| Daily Pivot Point S1 | 0.6115 |
| Daily Pivot Point S2 | 0.6080 |
| Daily Pivot Point S3 | 0.6040 |
| Daily Pivot Point R1 | 0.6190 |
| Daily Pivot Point R2 | 0.6230 |
| Daily Pivot Point R3 | 0.6265 |
[/s2If]
Download Nehcap EAWe have two EAs that are operational on our LIVE accounts.
- EA-FIX: Check out the details here. Download EA-FIX . EA-FIX is a non-grid HFT scalper.
- EA-GROWTH: High quality low dd EA using trend grids. Download EA_GROWTHJoin Our Telegram Group
")


