The USDCAD pair reached a high point not seen in almost three weeks on Monday, but there was not enough continuing buying pressure.
…
This is a premium post.
[s2If !current_user_can(access_s2member_level4)]Please register for FREE REGISTER to read full post below containing analysis. In case of any error or you think you are not able to read the full post below, please email us at support#nehcap.com [lwa][/s2If] [s2If current_user_can(access_s2member_level1)]
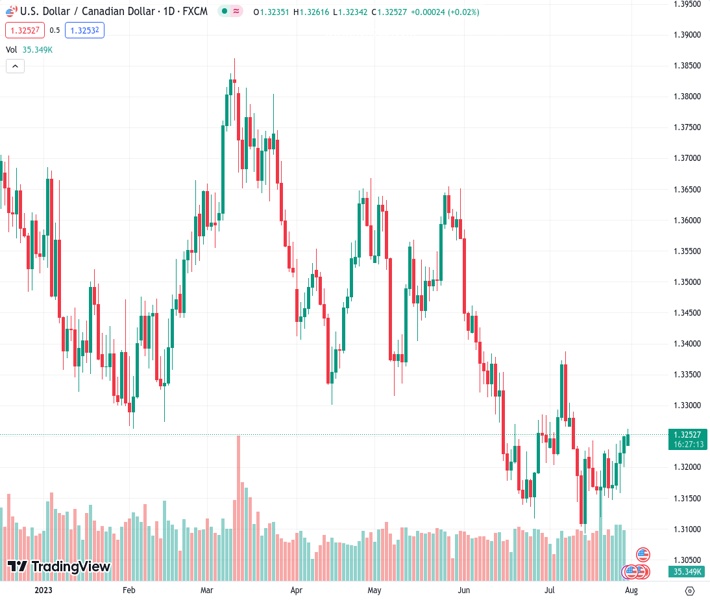
- USD/CAD touches a nearly three-week top on Monday, albeit lacks follow-through buying.
The pair currently trades last at 1.32529.
The previous day high was 1.3255 while the previous day low was 1.3201. The daily 38.2% Fib levels comes at 1.3234, expected to provide support. Similarly, the daily 61.8% fib level is at 1.3222, expected to provide support.
The USD/CAD pair attracts some dip-buying near the 1.3240 area on Monday and touches a nearly three-week high during the Asian session. Spot prices, however, struggle to capitalize on the modest uptick and currently trade around the 1.3250 region, nearly unchanged for the day.
Crude Oil prices edge lower as bulls opt to take some profits off the table following the recent rally to the highest level since April 19 touched on Friday. This, in turn, is seen undermining the commodity-linked Loonie, which, along with the emergence of some US Dollar (USD) buying, acts as a tailwind for the USD/CAD pair. That said, the uncertainty over the Federal Reserve’s (Fed) future rate-hike path, fueled by an extremely resilient US economy and signs of colling inflationary pressures, holds back traders from positioning for any further gains for the major.
From a technical perspective, any subsequent move up is more likely to remain capped near the 1.3300 strong horizontal support breakpoint, now turned resistance. The said handle now coincides with the 50-day Simple Moving Average (SMA) and should act as a pivotal point. A sustained strength beyond might trigger a short-covering rally and lift the USD/CAD pair towards the 1.3360 hurdle en route to the monthly peak, around the 1.3385 region. Some follow-through beyond the 1.3400 mark should pave the way for a further near-term appreciating move.
On the flip side, the Asian session low, around the 1.3240 region, now seems to protect the immediate downside ahead of the 1.3200 mark. Failure to defend the said support levels will expose the 1.3160 intermediate support, below which the USD/CAD pair could slide back toward resting sub-1.3100 levels, or its lowest level since September 2022 touched earlier this month. Some follow-through selling has the potential to drag spot prices further towards the 1.3050 horizontal zone en route to the next relevant support near the 1.3000 psychological mark.
Technical Levels: Supports and Resistances
USDCAD currently trading at 1.3254 at the time of writing. Pair opened at 1.3254 and is trading with a change of 0.0 % .
| Overview | Overview.1 | |
|---|---|---|
| 0 | Today last price | 1.3254 |
| 1 | Today Daily Change | 0.0000 |
| 2 | Today Daily Change % | 0.0000 |
| 3 | Today daily open | 1.3254 |
The pair is trading above its 20 Daily moving average @ 1.3219, below its 50 Daily moving average @ 1.3305 , below its 100 Daily moving average @ 1.3423 and below its 200 Daily moving average @ 1.3463
| Trends | Trends.1 | |
|---|---|---|
| 0 | Daily SMA20 | 1.3219 |
| 1 | Daily SMA50 | 1.3305 |
| 2 | Daily SMA100 | 1.3423 |
| 3 | Daily SMA200 | 1.3463 |
The previous day high was 1.3255 while the previous day low was 1.3201. The daily 38.2% Fib levels comes at 1.3234, expected to provide support. Similarly, the daily 61.8% fib level is at 1.3222, expected to provide support.
Note the levels of interest below:
- Pivot support is noted at 1.3218, 1.3183, 1.3165
- Pivot resistance is noted at 1.3272, 1.329, 1.3326
| Levels | Levels.1 |
|---|---|
| Previous Daily High | 1.3255 |
| Previous Daily Low | 1.3201 |
| Previous Weekly High | 1.3255 |
| Previous Weekly Low | 1.3147 |
| Previous Monthly High | 1.3585 |
| Previous Monthly Low | 1.3117 |
| Daily Fibonacci 38.2% | 1.3234 |
| Daily Fibonacci 61.8% | 1.3222 |
| Daily Pivot Point S1 | 1.3218 |
| Daily Pivot Point S2 | 1.3183 |
| Daily Pivot Point S3 | 1.3165 |
| Daily Pivot Point R1 | 1.3272 |
| Daily Pivot Point R2 | 1.3290 |
| Daily Pivot Point R3 | 1.3326 |
[/s2If]
Download Nehcap EAWe have two EAs that are operational on our LIVE accounts.
- EA-FIX: Check out the details here. Download EA-FIX . EA-FIX is a non-grid HFT scalper.
- EA-GROWTH: High quality low dd EA using trend grids. Download EA_GROWTHJoin Our Telegram Group
")


