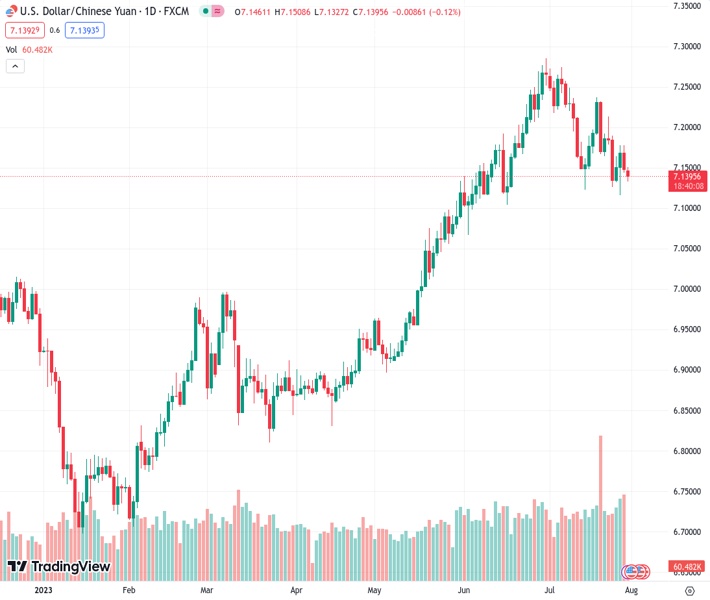
The USDCNH pair is facing selling pressure for the second day in a row with a current rate of 7.14089.
…
This is a premium post.
[s2If !current_user_can(access_s2member_level4)]Please register for FREE REGISTER to read full post below containing analysis. In case of any error or you think you are not able to read the full post below, please email us at support#nehcap.com [lwa][/s2If] [s2If current_user_can(access_s2member_level1)]
- USD/CNH remains under some selling pressure for the second successive day.
The pair currently trades last at 7.14089.
The previous day high was 7.1778 while the previous day low was 7.1444. The daily 38.2% Fib levels comes at 7.1572, expected to provide resistance. Similarly, the daily 61.8% fib level is at 7.1651, expected to provide resistance.
The USD/CNH pair drifts lower for the second successive day and drops to a two-day low, around the 7.1330 area after the release of mixed Chinese PMI prints for July during the Asian session on Monday. Spot prices, however, manage to rebound a few pips in the last hour and currently trade around the 7.1420 region, down just over 0.15% for the day.
In fact, data released by China’s National Bureau of Statistics (NBS) showed that the official Manufacturing PMI improved from 49 in the previous month to 49.3 in July, though remains in the contraction territory. Meanwhile, the gauge for the services sector dropped to 51.5 during the reported month as compared to 53.2 in June. That said, hopes for additional stimulus from China turn out to be a key factor exerting some pressure on the USD/CNH pair.
From a technical perspective, last week’s convincing break and acceptance below the 50-day Simple Moving Average (SMA) was seen as a fresh trigger for bearish traders. Moreover, oscillators on the daily chart have been gaining negative traction and support prospects for a further depreciating move. That said, it will be prudent to wait for some follow-through selling below the 7.1170-7.1160 horizontal support before placing fresh bearish bets around the USD/CNH pair.
Spot prices might then turn vulnerable to accelerate the slide to the 7.1040-7.1035 region en route to the 7.1000 round-figure mark. The fall could get extended further towards the next relevant support near the 7.06550 area.
On the flip side, the 50-day SMA, currently pegged around the 7.1720 zone, might continue to act as an immediate hurdle ahead of the 7.1775-7.1780 supply zone and the 7.1910-7.1915 region. This is followed by a resistance marked by a descending trend-line extending from the June swing high, around the 7.2135-7.2140 area. A sustained strength beyond the latter will negate any near-term negative bias and pave the way for some meaningful upside for the USD/CNH pair.
Technical Levels: Supports and Resistances
USDCNH currently trading at 7.1426 at the time of writing. Pair opened at 7.1532 and is trading with a change of -0.15 % .
| Overview | Overview.1 | |
|---|---|---|
| 0 | Today last price | 7.1426 |
| 1 | Today Daily Change | -0.0106 |
| 2 | Today Daily Change % | -0.1500 |
| 3 | Today daily open | 7.1532 |
The pair is trading below its 20 Daily moving average @ 7.1956, below its 50 Daily moving average @ 7.1672 , above its 100 Daily moving average @ 7.0379 and above its 200 Daily moving average @ 7.0047
| Trends | Trends.1 | |
|---|---|---|
| 0 | Daily SMA20 | 7.1956 |
| 1 | Daily SMA50 | 7.1672 |
| 2 | Daily SMA100 | 7.0379 |
| 3 | Daily SMA200 | 7.0047 |
The previous day high was 7.1778 while the previous day low was 7.1444. The daily 38.2% Fib levels comes at 7.1572, expected to provide resistance. Similarly, the daily 61.8% fib level is at 7.1651, expected to provide resistance.
Note the levels of interest below:
- Pivot support is noted at 7.1392, 7.1251, 7.1058
- Pivot resistance is noted at 7.1726, 7.1919, 7.206
| Levels | Levels.1 |
|---|---|
| Previous Daily High | 7.1778 |
| Previous Daily Low | 7.1444 |
| Previous Weekly High | 7.2134 |
| Previous Weekly Low | 7.1160 |
| Previous Monthly High | 7.2856 |
| Previous Monthly Low | 7.0668 |
| Daily Fibonacci 38.2% | 7.1572 |
| Daily Fibonacci 61.8% | 7.1651 |
| Daily Pivot Point S1 | 7.1392 |
| Daily Pivot Point S2 | 7.1251 |
| Daily Pivot Point S3 | 7.1058 |
| Daily Pivot Point R1 | 7.1726 |
| Daily Pivot Point R2 | 7.1919 |
| Daily Pivot Point R3 | 7.2060 |
[/s2If]
Download Nehcap EAWe have two EAs that are operational on our LIVE accounts.
- EA-FIX: Check out the details here. Download EA-FIX . EA-FIX is a non-grid HFT scalper.
- EA-GROWTH: High quality low dd EA using trend grids. Download EA_GROWTHJoin Our Telegram Group
")


