Metals are experiencing downward pressure after the release of better-than-anticipated economic data from the US.
…
This is a premium post.
[s2If !current_user_can(access_s2member_level4)]Please register for FREE REGISTER to read full post below containing analysis. In case of any error or you think you are not able to read the full post below, please email us at support#nehcap.com [lwa][/s2If] [s2If current_user_can(access_s2member_level1)]
- Metals under pressure following stronger-than-expected US data.
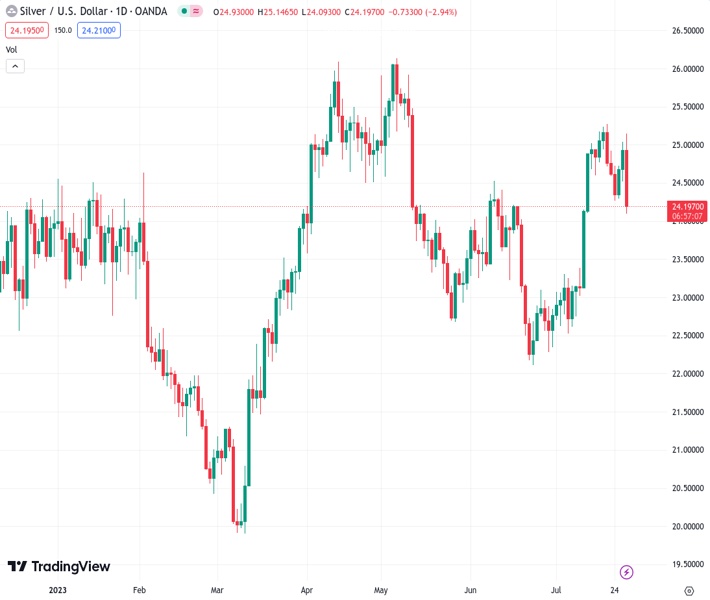
The pair currently trades last at 24.172.
The previous day high was 25.04 while the previous day low was 24.52. The daily 38.2% Fib levels comes at 24.84, expected to provide resistance. Similarly, the daily 61.8% fib level is at 24.72, expected to provide resistance.
Silver has reversed sharply following the release of US economic data that came in above expectations. XAG/USD dropped from weekly highs above $25.00 to the $24.50 area in a few minutes, falling 1.50% on a daily basis. The metal also erased weekly gains.
The US economy grew at a 2.4% annual rate during the second quarter, above the market consensus of 1.8%. The report showed that the GDP deflator declined from 4.1% to 2.6% and the Core Personal Consumption Expenditures Index from 4.9% to 3.8%. The June Durable Goods Order report showed a 4.7% increase, above the estimated 1%. Initial Jobless Claims dropped to 221K, the lowest in five months.
The numbers triggered a rally for the US dollar across the board and sent US yields to the upside. Metals tumbled after the report, with Gold losing more than $20 since the data came out and trading at $1,955.
XAG/USD is testing the $24.50 area and below, with attention turning to the weekly low at the $24.25 area. The next support is seen at $24.00/23.95. The short-term outlook for Silver has turned negative, and a rebound above $25.00 would be needed to reverse it. Before that, an interim resistance emerges at $24.70.
Technical Levels: Supports and Resistances
XAGUSD currently trading at 24.53 at the time of writing. Pair opened at 24.93 and is trading with a change of -1.6 % .
| Overview | Overview.1 | |
|---|---|---|
| 0 | Today last price | 24.53 |
| 1 | Today Daily Change | -0.40 |
| 2 | Today Daily Change % | -1.60 |
| 3 | Today daily open | 24.93 |
The pair remains strongly bullish on the daily timeframe. It trades above its 20 SMA @ 23.94, 50 SMA 23.63, 100 SMA @ 23.84 and 200 SMA @ 23.0.
| Trends | Trends.1 | |
|---|---|---|
| 0 | Daily SMA20 | 23.94 |
| 1 | Daily SMA50 | 23.63 |
| 2 | Daily SMA100 | 23.84 |
| 3 | Daily SMA200 | 23.00 |
The previous day high was 25.04 while the previous day low was 24.52. The daily 38.2% Fib levels comes at 24.84, expected to provide resistance. Similarly, the daily 61.8% fib level is at 24.72, expected to provide resistance.
Note the levels of interest below:
- Pivot support is noted at 24.62, 24.31, 24.1
- Pivot resistance is noted at 25.14, 25.35, 25.66
| Levels | Levels.1 |
|---|---|
| Previous Daily High | 25.04 |
| Previous Daily Low | 24.52 |
| Previous Weekly High | 25.27 |
| Previous Weekly Low | 24.59 |
| Previous Monthly High | 24.53 |
| Previous Monthly Low | 22.11 |
| Daily Fibonacci 38.2% | 24.84 |
| Daily Fibonacci 61.8% | 24.72 |
| Daily Pivot Point S1 | 24.62 |
| Daily Pivot Point S2 | 24.31 |
| Daily Pivot Point S3 | 24.10 |
| Daily Pivot Point R1 | 25.14 |
| Daily Pivot Point R2 | 25.35 |
| Daily Pivot Point R3 | 25.66 |
[/s2If]
Download Nehcap EAWe have two EAs that are operational on our LIVE accounts.
- EA-FIX: Check out the details here. Download EA-FIX . EA-FIX is a non-grid HFT scalper.
- EA-GROWTH: High quality low dd EA using trend grids. Download EA_GROWTHJoin Our Telegram Group
")


