During the early European session, there is a perception that the US dollar against the Mexican peso is stabilizing within a small range of trading.
…
This is a premium post.
[s2If !current_user_can(access_s2member_level4)]Please register for FREE REGISTER to read full post below containing analysis. In case of any error or you think you are not able to read the full post below, please email us at support#nehcap.com [lwa][/s2If] [s2If current_user_can(access_s2member_level1)]
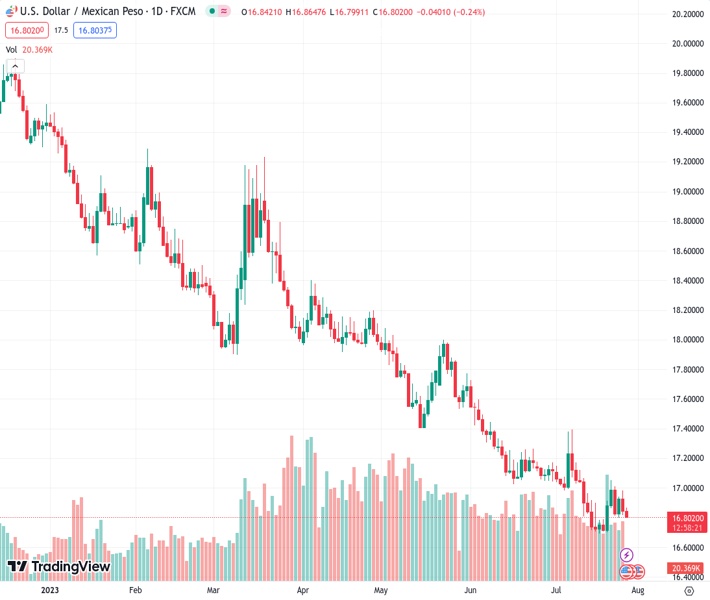
- USD/MXN is seen consolidating in a narrow trading band through the early European session.
The pair currently trades last at 16.8003.
The previous day high was 16.9837 while the previous day low was 16.8166. The daily 38.2% Fib levels comes at 16.8804, expected to provide resistance. Similarly, the daily 61.8% fib level is at 16.9199, expected to provide resistance.
The USD/MXN pair lacks any firm intraday direction on Thursday and oscillates in a narrow trading band, below the 16.85 level through the early European session.
From a technical perspective, spot prices currently hover around the confluence comprising of the 200-hour Simple Moving Average (SMA) and the 61.8% Fibonacci retracement level of the recent modest recovery from the lowest level since December 2015. Some follow-through selling below the overnight swing low, around the 16.80 area, will be seen as a fresh trigger for bearish traders and pave the way for a further near-term depreciating move.
Meanwhile, oscillators on the daily chart – though have been recovering – are still holding in the bearish territory and have again started gaining negative traction on hourly charts. This, in turn, suggests that the path of least resistance for the USD/MXN pair is to the downside. Hence, a subsequent slide back towards challenging the multi-year low, around the 16.70 region touched last week, looks like a distinct possibility.
Sustained weakness below the latter will be seen as a fresh trigger for bearish traders and expose the next relevant support near the 16.60 region. The USD/MXN pair could extend the downward trajectory and eventually drop to October/November 2015 lows, around the 16.3555-16.3250 area.
On the flip side, the 50% Fibo. level, around the 16.8740-16.8745 region now seems to act as an immediate strong barrier. A sustained strength beyond might trigger a short-covering move towards the 16.9200 zone en route to the 16.9600-16.9700 supply zone. The latter coincides with the 23.6% Fibo. level, which if cleared decisively will negate the negative outlook and lift the USD/MXN back above the 17.00 mark.
Technical Levels: Supports and Resistances
USDMXN currently trading at 16.8104 at the time of writing. Pair opened at 16.8428 and is trading with a change of -0.19 % .
| Overview | Overview.1 | |
|---|---|---|
| 0 | Today last price | 16.8104 |
| 1 | Today Daily Change | -0.0324 |
| 2 | Today Daily Change % | -0.1900 |
| 3 | Today daily open | 16.8428 |
The pair remains strongly bearish on the daily time frame. It trades below the 20 SMA @ 16.9508, 50 SMA 17.2302, 100 SMA @ 17.6831 and 200 SMA @ 18.4188.
| Trends | Trends.1 | |
|---|---|---|
| 0 | Daily SMA20 | 16.9508 |
| 1 | Daily SMA50 | 17.2302 |
| 2 | Daily SMA100 | 17.6831 |
| 3 | Daily SMA200 | 18.4188 |
The previous day high was 16.9837 while the previous day low was 16.8166. The daily 38.2% Fib levels comes at 16.8804, expected to provide resistance. Similarly, the daily 61.8% fib level is at 16.9199, expected to provide resistance.
Note the levels of interest below:
- Pivot support is noted at 16.7783, 16.7139, 16.6112
- Pivot resistance is noted at 16.9455, 17.0482, 17.1126
| Levels | Levels.1 |
|---|---|
| Previous Daily High | 16.9837 |
| Previous Daily Low | 16.8166 |
| Previous Weekly High | 17.0512 |
| Previous Weekly Low | 16.6924 |
| Previous Monthly High | 17.7286 |
| Previous Monthly Low | 17.0243 |
| Daily Fibonacci 38.2% | 16.8804 |
| Daily Fibonacci 61.8% | 16.9199 |
| Daily Pivot Point S1 | 16.7783 |
| Daily Pivot Point S2 | 16.7139 |
| Daily Pivot Point S3 | 16.6112 |
| Daily Pivot Point R1 | 16.9455 |
| Daily Pivot Point R2 | 17.0482 |
| Daily Pivot Point R3 | 17.1126 |
[/s2If]
Download Nehcap EAWe have two EAs that are operational on our LIVE accounts.
- EA-FIX: Check out the details here. Download EA-FIX . EA-FIX is a non-grid HFT scalper.
- EA-GROWTH: High quality low dd EA using trend grids. Download EA_GROWTHJoin Our Telegram Group


