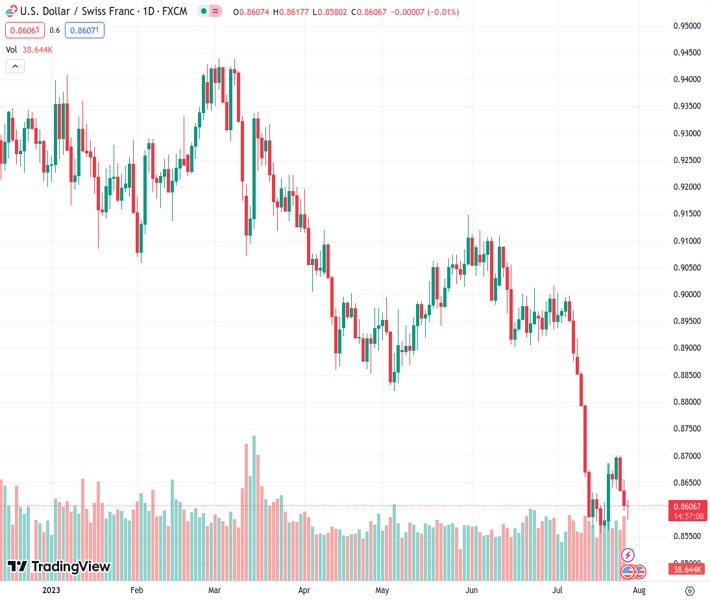
The USDCHF pair, currently trading at 0.86117, continues to face downward pressure for the third day in a row as it moves closer to its lowest levels in several years, which were recorded last week.
…
This is a premium post.
[s2If !current_user_can(access_s2member_level4)]Please register for FREE REGISTER to read full post below containing analysis. In case of any error or you think you are not able to read the full post below, please email us at support#nehcap.com [lwa][/s2If] [s2If current_user_can(access_s2member_level1)]
- USD/CHF remains pressured for the third consecutive day while declining toward multi-year low marked the last week.
The pair currently trades last at 0.86117.
The previous day high was 0.8656 while the previous day low was 0.8598. The daily 38.2% Fib levels comes at 0.862, expected to provide resistance. Similarly, the daily 61.8% fib level is at 0.8634, expected to provide resistance.
USD/CHF bears jostle with the key support around 0.8580 as markets brace for the European Central Bank (ECB) monetary policy decision during early Thursday, making rounds to 0.8600 round figure by the press time.
Even so, the Swiss Franc (CHF) pair stays bearish for the third consecutive day amid the broad US Dollar weakness, as well as due to the market’s cautious optimism. That said, the US Dollar Index (DXY) prints a three-day downtrend despite the Federal Reserve’s (Fed) 0.25% interest rate hike, as well as readiness for an interest rate increase in September, amid fears of a sooner end to the tightening spell. Also likely to have weighed on the greenback could be expectations of witnessing further easing in the US data, which in turn will challenge the Fed from lifting the rates in September.
It’s worth observing that the US stock futures regain upside momentum targeting the yearly high marked the previous day while equities in the Asia-Pacific zone also edge higher as market participants sense a sooner end to the rate hike trajectory at the major central banks. Additionally, improvements in China data and the International Monetary Fund’s (IMF) rejection of the recession woes also underpin the market’s mildly positive outlook.
It should be noted that the Swiss National Bank (SNB) appears more hawkish compared to the Fed and hence exert downside pressure on the USD/CHF prices.
Looking ahead, the first readings of the US Gross Domestic Product (GDP) Annualized for the second quarter (Q2), expected to ease to 1.8% from 2.0%, will be important to watch for clear directions. Also crucial will be the US Durable Goods Orders for June, likely easing to 1.0% from 1.8% prior (revised), as well as the monetary policy announcements from the European Central Bank (ECB).
A seven-week-old rising support line, around 0.8580 by the press time, challenges USD/CHF bears from refreshing the lowest level since 2015 by breaking the 0.8555 mark. That said, the nearly oversold RSI also prods the Swiss Franc (CHF) buyers. However, a corrective bounce remains elusive unless crossing May’s bottom of 0.8820.
Technical Levels: Supports and Resistances
USDCHF currently trading at 0.8602 at the time of writing. Pair opened at 0.8608 and is trading with a change of -0.07% % .
| Overview | Overview.1 | |
|---|---|---|
| 0 | Today last price | 0.8602 |
| 1 | Today Daily Change | -0.0006 |
| 2 | Today Daily Change % | -0.07% |
| 3 | Today daily open | 0.8608 |
The pair remains strongly bearish on the daily time frame. It trades below the 20 SMA @ 0.8764, 50 SMA 0.8915, 100 SMA @ 0.898 and 200 SMA @ 0.9198.
| Trends | Trends.1 | |
|---|---|---|
| 0 | Daily SMA20 | 0.8764 |
| 1 | Daily SMA50 | 0.8915 |
| 2 | Daily SMA100 | 0.8980 |
| 3 | Daily SMA200 | 0.9198 |
The previous day high was 0.8656 while the previous day low was 0.8598. The daily 38.2% Fib levels comes at 0.862, expected to provide resistance. Similarly, the daily 61.8% fib level is at 0.8634, expected to provide resistance.
Note the levels of interest below:
- Pivot support is noted at 0.8585, 0.8562, 0.8526
- Pivot resistance is noted at 0.8644, 0.868, 0.8703
| Levels | Levels.1 |
|---|---|
| Previous Daily High | 0.8656 |
| Previous Daily Low | 0.8598 |
| Previous Weekly High | 0.8684 |
| Previous Weekly Low | 0.8555 |
| Previous Monthly High | 0.9120 |
| Previous Monthly Low | 0.8902 |
| Daily Fibonacci 38.2% | 0.8620 |
| Daily Fibonacci 61.8% | 0.8634 |
| Daily Pivot Point S1 | 0.8585 |
| Daily Pivot Point S2 | 0.8562 |
| Daily Pivot Point S3 | 0.8526 |
| Daily Pivot Point R1 | 0.8644 |
| Daily Pivot Point R2 | 0.8680 |
| Daily Pivot Point R3 | 0.8703 |
[/s2If]
Download Nehcap EAWe have two EAs that are operational on our LIVE accounts.
- EA-FIX: Check out the details here. Download EA-FIX . EA-FIX is a non-grid HFT scalper.
- EA-GROWTH: High quality low dd EA using trend grids. Download EA_GROWTHJoin Our Telegram Group


