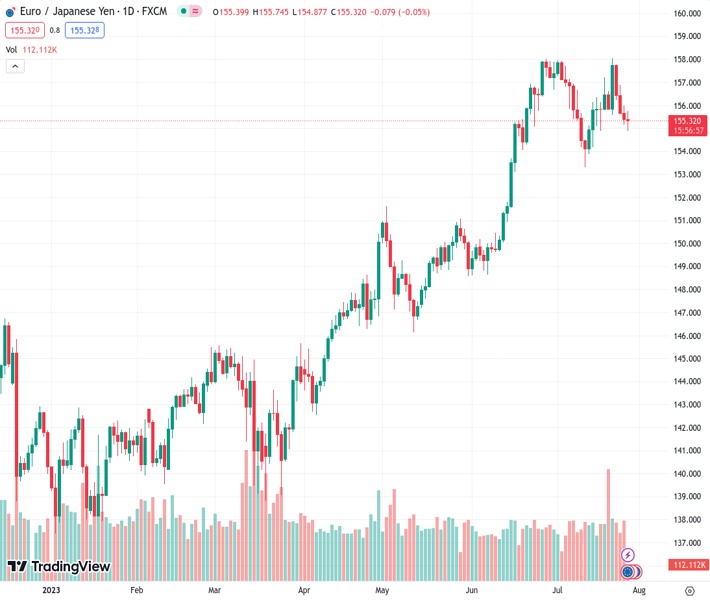
The price analysis of EURJPY indicates that it is maintaining a defensive stance above the 155.00 area, with the focus on the European Central Bank (ECB) and the Bank of Japan (BoJ).
…
This is a premium post.
[s2If !current_user_can(access_s2member_level4)]Please register for FREE REGISTER to read full post below containing analysis. In case of any error or you think you are not able to read the full post below, please email us at support#nehcap.com [lwa][/s2If] [s2If current_user_can(access_s2member_level1)]
- The pair currently trades last at 155.315.
- Pivot support is noted at 155.08, 154.69, 154.24
- Pivot resistance is noted at 155.93, 156.38, 156.77
- EA-FIX: Check out the details here. Download EA-FIX . EA-FIX is a non-grid HFT scalper.
- EA-GROWTH: High quality low dd EA using trend grids. Download EA_GROWTHJoin Our Telegram Group
The previous day high was 155.99 while the previous day low was 155.15. The daily 38.2% Fib levels comes at 155.47, expected to provide resistance. Similarly, the daily 61.8% fib level is at 155.67, expected to provide resistance.
The EUR/JPY pair loses momentum and remains on the defensive above 155.00 in the Asian session. Market participants await the outcome of the European Central Bank (ECB) and Bank of Japan (BoJ) meetings scheduled for Thursday and Friday.
The ECB is expected to raise interest rates by 25 basis points (bps) on Thursday. Market participants speculate that the ECB will raise borrowing costs in July and September to bring inflation back to target. The concern about the economic slowdown in the Eurozone exerts pressure on the Euro against its rivals. However, ECB President Christine Lagarde will offer hints about further monetary policy and might allow the Euro to stay firmer.
On the other hand, BoJ Governor Kazuo Ueda put an end to speculation of a Yield Control Curve policy change and said that there was still some way to go before reaching the 2% inflation target. Japanese policymakers are likely to maintain an ultra-easy monetary policy on Friday. This, in turn, might lead to the weakening of the Japanese Yen against its major rivals due to monetary policy divergences.
According to the one-hour chart, EUR/JPY holds below the 50- and 100-hour Exponential Moving Averages (EMAs), which means further downside looks favorable. Meanwhile, the Relative Strength Index (RSI) stands below 50, within bearish territory, suggesting that sellers will likely retain control soon.
Therefore, the cross could meet the immediate resistance level of 155.40 (50-hour EMA), followed by 155.50 (100-hour EMA). The additional upside filter to watch is 155.75 (High July 26). The 156.00 area appears to be a tough nut to crack for EUR/JPY.
On the flip side, any extended weakness below the 154.90–155.00 zone (a psychological round mark and low of July 27) will challenge the initial support level of 154.50 (Low of July 14). Further south, the cross will see a drop to 154.00, highlighting a psychological round figure and a low of July 13.
Technical Levels: Supports and Resistances
EURJPY currently trading at 155.28 at the time of writing. Pair opened at 155.47 and is trading with a change of -0.12 % .
| Overview | Overview.1 | |
|---|---|---|
| 0 | Today last price | 155.28 |
| 1 | Today Daily Change | -0.19 |
| 2 | Today Daily Change % | -0.12 |
| 3 | Today daily open | 155.47 |
The pair is trading below its 20 Daily moving average @ 156.2, above its 50 Daily moving average @ 153.65 , above its 100 Daily moving average @ 149.63 and above its 200 Daily moving average @ 146.39
| Trends | Trends.1 | |
|---|---|---|
| 0 | Daily SMA20 | 156.20 |
| 1 | Daily SMA50 | 153.65 |
| 2 | Daily SMA100 | 149.63 |
| 3 | Daily SMA200 | 146.39 |
The previous day high was 155.99 while the previous day low was 155.15. The daily 38.2% Fib levels comes at 155.47, expected to provide resistance. Similarly, the daily 61.8% fib level is at 155.67, expected to provide resistance.
Note the levels of interest below:
| Levels | Levels.1 |
|---|---|
| Previous Daily High | 155.99 |
| Previous Daily Low | 155.15 |
| Previous Weekly High | 158.05 |
| Previous Weekly Low | 154.88 |
| Previous Monthly High | 158.00 |
| Previous Monthly Low | 148.62 |
| Daily Fibonacci 38.2% | 155.47 |
| Daily Fibonacci 61.8% | 155.67 |
| Daily Pivot Point S1 | 155.08 |
| Daily Pivot Point S2 | 154.69 |
| Daily Pivot Point S3 | 154.24 |
| Daily Pivot Point R1 | 155.93 |
| Daily Pivot Point R2 | 156.38 |
| Daily Pivot Point R3 | 156.77 |
[/s2If]
Download Nehcap EAWe have two EAs that are operational on our LIVE accounts.


