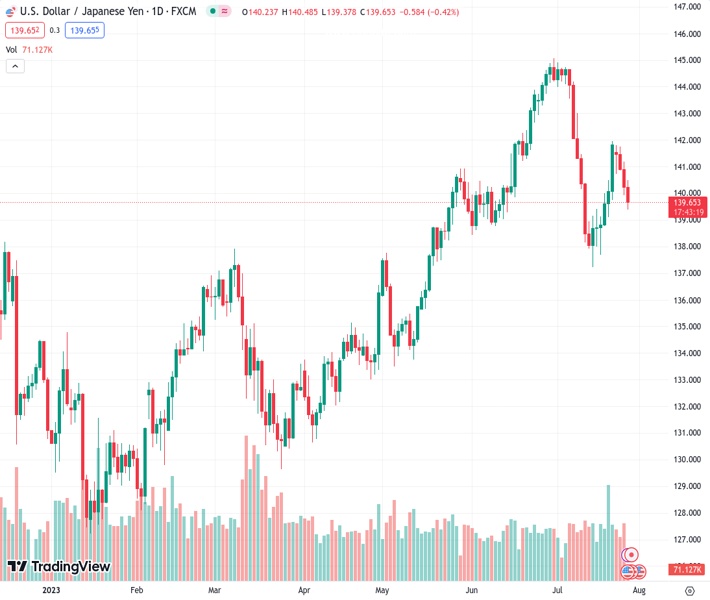
The USDJPY currency pair has reached a new lowest point for the week at 139.729, following a recent break of a support line that had been in place for two weeks. According to the viewpoint of @nehcap, it is anticipated that there will be further decline in value.
…
This is a premium post.
[s2If !current_user_can(access_s2member_level4)]Please register for FREE REGISTER to read full post below containing analysis. In case of any error or you think you are not able to read the full post below, please email us at support#nehcap.com [lwa][/s2If] [s2If current_user_can(access_s2member_level1)]
- USD/JPY renews weekly low after breaking fortnight-old rising support line.
The pair currently trades last at 139.729.
The previous day high was 141.18 while the previous day low was 139.92. The daily 38.2% Fib levels comes at 140.4, expected to provide resistance. Similarly, the daily 61.8% fib level is at 140.7, expected to provide resistance.
USD/JPY drops for the fourth consecutive day as it breaks a two-week-old rising support line, now immediate resistance, to refresh the weekly low near 139.40, close to 139.70 by the press time of early Thursday morning in Europe.
In doing so, the Yen pair also justifies the market’s chatters that the Bank of Japan (BoJ) is overdue for a policy tweak. Also exerting downside pressure on the Yen price could be the broad-based US Dollar weakness despite the Federal Reserve’s (Fed) hawkish rate hike amid fears of a sooner end to the tightening spell. That said, the DXY prints a three-day losing streak, down 0.24% intraday near 100.78 by the press time.
Amid these plays, the USD/JPY pair is likely to extend the latest fall towards the 50% Fibonacci retracement of its May-June upside, near 139.30.
However, a convergence of an ascending support line from early May and the 61.8% Fibonacci retracement, near 137.90, appears a tough nut to crack for the Yen pair sellers.
Alternatively, a corrective bounce needs validation from the previous support line stretched from mid-July, close to 140.40, as well as a downward-sloping resistance line from early June, close to 141.15 by the press time.
Even so, the 200-SMA level of around 141.65 at the latest will act as the final defense of the USD/JPY bears.
Trend: Further downside expected
Technical Levels: Supports and Resistances
USDJPY currently trading at 139.71 at the time of writing. Pair opened at 140.24 and is trading with a change of -0.38% % .
| Overview | Overview.1 | |
|---|---|---|
| 0 | Today last price | 139.71 |
| 1 | Today Daily Change | -0.53 |
| 2 | Today Daily Change % | -0.38% |
| 3 | Today daily open | 140.24 |
The pair is trading below its 20 Daily moving average @ 141.39, below its 50 Daily moving average @ 140.88 , above its 100 Daily moving average @ 137.32 and above its 200 Daily moving average @ 136.79
| Trends | Trends.1 | |
|---|---|---|
| 0 | Daily SMA20 | 141.39 |
| 1 | Daily SMA50 | 140.88 |
| 2 | Daily SMA100 | 137.32 |
| 3 | Daily SMA200 | 136.79 |
The previous day high was 141.18 while the previous day low was 139.92. The daily 38.2% Fib levels comes at 140.4, expected to provide resistance. Similarly, the daily 61.8% fib level is at 140.7, expected to provide resistance.
Note the levels of interest below:
- Pivot support is noted at 139.72, 139.19, 138.45
- Pivot resistance is noted at 140.98, 141.71, 142.24
| Levels | Levels.1 |
|---|---|
| Previous Daily High | 141.18 |
| Previous Daily Low | 139.92 |
| Previous Weekly High | 141.96 |
| Previous Weekly Low | 137.68 |
| Previous Monthly High | 145.07 |
| Previous Monthly Low | 138.43 |
| Daily Fibonacci 38.2% | 140.40 |
| Daily Fibonacci 61.8% | 140.70 |
| Daily Pivot Point S1 | 139.72 |
| Daily Pivot Point S2 | 139.19 |
| Daily Pivot Point S3 | 138.45 |
| Daily Pivot Point R1 | 140.98 |
| Daily Pivot Point R2 | 141.71 |
| Daily Pivot Point R3 | 142.24 |
[/s2If]
Download Nehcap EAWe have two EAs that are operational on our LIVE accounts.
- EA-FIX: Check out the details here. Download EA-FIX . EA-FIX is a non-grid HFT scalper.
- EA-GROWTH: High quality low dd EA using trend grids. Download EA_GROWTHJoin Our Telegram Group
")


