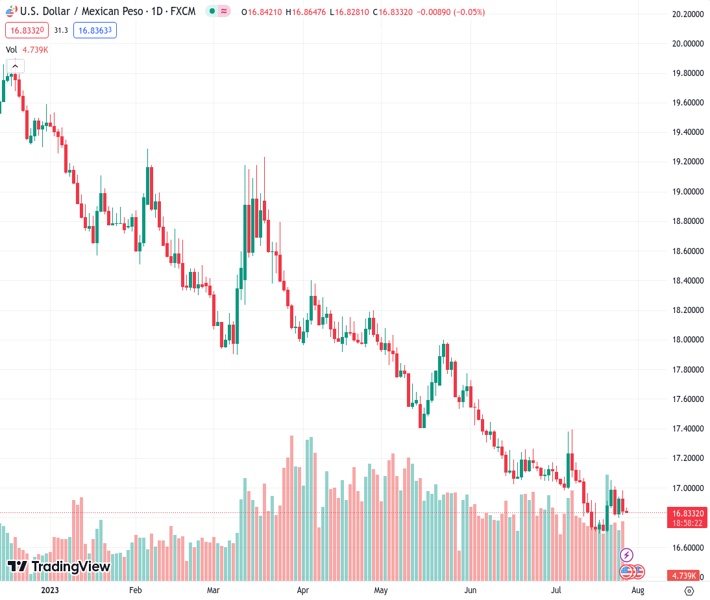
The US dollar to Mexican peso exchange rate, currently at 16.8386, remains stagnant and confined to a narrow trading range that has been ongoing for a week. According to the opinion of @nehcap, there is only a small chance for a partial rebound in the near future.
…
This is a premium post.
[s2If !current_user_can(access_s2member_level4)]Please register for FREE REGISTER to read full post below containing analysis. In case of any error or you think you are not able to read the full post below, please email us at support#nehcap.com [lwa][/s2If] [s2If current_user_can(access_s2member_level1)]
- USD/MXN licks its wounds within one-week-old trading range.
The pair currently trades last at 16.8386.
The previous day high was 16.9837 while the previous day low was 16.8166. The daily 38.2% Fib levels comes at 16.8804, expected to provide resistance. Similarly, the daily 61.8% fib level is at 16.9199, expected to provide resistance.
USD/MXN stabilizes near 16.85 amid an inactive Thursday morning in Asia, after posting heavy losses the previous day. With this, the Mexican Peso (MXN) pair stays within its one-week-long trading range between the 21-DMA and 10-DMA.
Given the Mexican Peso pair’s latest rebound from the 10-DMA gaining support from the bullish MACD signals and the steady RSI (14) line, the USD/MXN price is likely to improve.
However, a clear upside break of the 21-DMA hurdle of around 16.95 becomes necessary to convince the pair buyers.
Even so, a 10-week-old bearish trend channel, currently between 17.14 and 16.35, will restrict the USD/MXN upside.
It’s worth observing that a horizontal area comprising multiple levels marked since mid-May, around 17.38-42, acts as the last defense of the USD/MXN bears.
On the contrary, a downside break of the 10-DMA support of around 16.82 isn’t an open welcome for the USD/MXN bears as a fortnight-old horizontal support near 16.70 acts as a tough nut to crack for the sellers.
Following that, the bottom line of the previously mentioned bearish channel, near 16.35, will lure the pair bears ahead of highlighting the 16.00 round figure.
Trend: Limited recovery expected
Technical Levels: Supports and Resistances
USDMXN currently trading at 16.8492 at the time of writing. Pair opened at 16.8428 and is trading with a change of 0.04% % .
| Overview | Overview.1 | |
|---|---|---|
| 0 | Today last price | 16.8492 |
| 1 | Today Daily Change | 0.0064 |
| 2 | Today Daily Change % | 0.04% |
| 3 | Today daily open | 16.8428 |
The pair remains strongly bearish on the daily time frame. It trades below the 20 SMA @ 16.9508, 50 SMA 17.2302, 100 SMA @ 17.6831 and 200 SMA @ 18.4188.
| Trends | Trends.1 | |
|---|---|---|
| 0 | Daily SMA20 | 16.9508 |
| 1 | Daily SMA50 | 17.2302 |
| 2 | Daily SMA100 | 17.6831 |
| 3 | Daily SMA200 | 18.4188 |
The previous day high was 16.9837 while the previous day low was 16.8166. The daily 38.2% Fib levels comes at 16.8804, expected to provide resistance. Similarly, the daily 61.8% fib level is at 16.9199, expected to provide resistance.
Note the levels of interest below:
- Pivot support is noted at 16.7783, 16.7139, 16.6112
- Pivot resistance is noted at 16.9455, 17.0482, 17.1126
| Levels | Levels.1 |
|---|---|
| Previous Daily High | 16.9837 |
| Previous Daily Low | 16.8166 |
| Previous Weekly High | 17.0512 |
| Previous Weekly Low | 16.6924 |
| Previous Monthly High | 17.7286 |
| Previous Monthly Low | 17.0243 |
| Daily Fibonacci 38.2% | 16.8804 |
| Daily Fibonacci 61.8% | 16.9199 |
| Daily Pivot Point S1 | 16.7783 |
| Daily Pivot Point S2 | 16.7139 |
| Daily Pivot Point S3 | 16.6112 |
| Daily Pivot Point R1 | 16.9455 |
| Daily Pivot Point R2 | 17.0482 |
| Daily Pivot Point R3 | 17.1126 |
[/s2If]
Download Nehcap EAWe have two EAs that are operational on our LIVE accounts.
- EA-FIX: Check out the details here. Download EA-FIX . EA-FIX is a non-grid HFT scalper.
- EA-GROWTH: High quality low dd EA using trend grids. Download EA_GROWTHJoin Our Telegram Group
")


