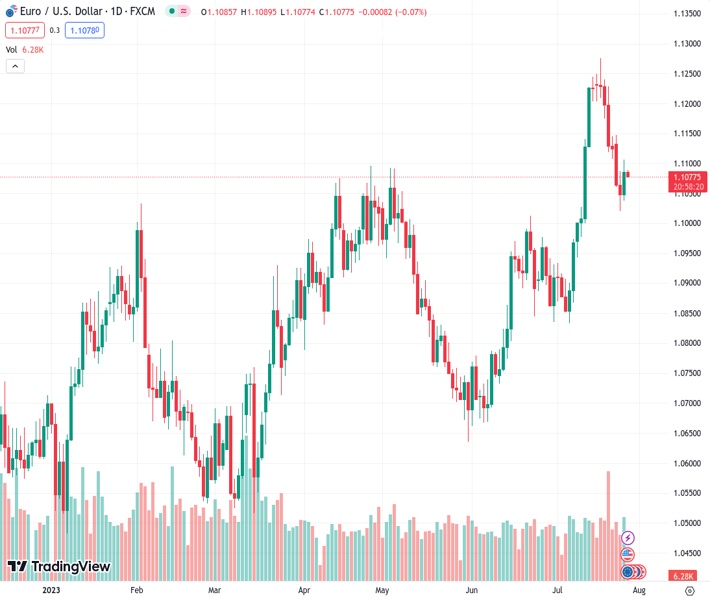
The EURUSD currency pair, currently at 1.10780, has reduced its gains following the Federal Reserve’s announcement. This decline has occurred within a descending trend channel that has been in place for the past eight days. However, @nehcap holds the belief that the currency pair will continue to rise in the future.
…
This is a premium post.
[s2If !current_user_can(access_s2member_level4)]Please register for FREE REGISTER to read full post below containing analysis. In case of any error or you think you are not able to read the full post below, please email us at support#nehcap.com [lwa][/s2If] [s2If current_user_can(access_s2member_level1)]
- EUR/USD pares post-Fed gains within eight-day-old descending trend channel.
The pair currently trades last at 1.10780.
The previous day high was 1.1087 while the previous day low was 1.1021. The daily 38.2% Fib levels comes at 1.1046, expected to provide support. Similarly, the daily 61.8% fib level is at 1.1062, expected to provide support.
EUR/USD reverses corrective bounce off a two-week low with an eight-day-old bearish trend channel, declining 0.07% intraday to 1.1080 amid the early hours of Thursday’s Asian session.
In doing so, the Euro pair consolidates the previous day’s gains amid hopes of witnessing a dovish outcome from the European Central Bank (ECB), other than the widely expected 0.25% rate hike from the ECB. It should be noted that the cautious mood ahead of the first readings of the US Gross Domestic Product (GDP) for the second quarter (Q2) Annualized, expected to ease to 1.8% from 2.0%, as well as the Durable Goods Orders for June, likely easing to 1.0% from 1.8% prior (revised), also weigh on the EUR/USD price.
Technically, the EUR/USD pair is likely to defy the latest bearish channel formation by taking clues from the bullish MACD signals and upbeat RSI (14).
Adding strength to the bullish bias for the Euro pair could be the successful trading above the five-week-old horizontal support zone, around 1.1000, as well as an upward-sloping support line stretched from late May, close to 1.0945 by the press time.
In a case where the EUR/USD remains weaker past 1.0945, the odds of witnessing a slump toward the monthly low of 1.0833 can’t be ruled out.
On the flip side, a clear break of 1.1110 will defy the bearish channel but the 50-SMA hurdle of around 1.1150 prods the Euro bulls before directing them to the yearly top marked on July 18 around 1.1275.
Trend: Further upside expected
Technical Levels: Supports and Resistances
EURUSD currently trading at 1.1083 at the time of writing. Pair opened at 1.1052 and is trading with a change of 0.28% % .
| Overview | Overview.1 | |
|---|---|---|
| 0 | Today last price | 1.1083 |
| 1 | Today Daily Change | 0.0031 |
| 2 | Today Daily Change % | 0.28% |
| 3 | Today daily open | 1.1052 |
The pair remains strongly bullish on the daily timeframe. It trades above its 20 SMA @ 1.1041, 50 SMA 1.0901, 100 SMA @ 1.0891 and 200 SMA @ 1.0701.
| Trends | Trends.1 | |
|---|---|---|
| 0 | Daily SMA20 | 1.1041 |
| 1 | Daily SMA50 | 1.0901 |
| 2 | Daily SMA100 | 1.0891 |
| 3 | Daily SMA200 | 1.0701 |
The previous day high was 1.1087 while the previous day low was 1.1021. The daily 38.2% Fib levels comes at 1.1046, expected to provide support. Similarly, the daily 61.8% fib level is at 1.1062, expected to provide support.
Note the levels of interest below:
- Pivot support is noted at 1.102, 1.0987, 1.0954
- Pivot resistance is noted at 1.1086, 1.1119, 1.1152
| Levels | Levels.1 |
|---|---|
| Previous Daily High | 1.1087 |
| Previous Daily Low | 1.1021 |
| Previous Weekly High | 1.1276 |
| Previous Weekly Low | 1.1108 |
| Previous Monthly High | 1.1012 |
| Previous Monthly Low | 1.0662 |
| Daily Fibonacci 38.2% | 1.1046 |
| Daily Fibonacci 61.8% | 1.1062 |
| Daily Pivot Point S1 | 1.1020 |
| Daily Pivot Point S2 | 1.0987 |
| Daily Pivot Point S3 | 1.0954 |
| Daily Pivot Point R1 | 1.1086 |
| Daily Pivot Point R2 | 1.1119 |
| Daily Pivot Point R3 | 1.1152 |
[/s2If]
Download Nehcap EAWe have two EAs that are operational on our LIVE accounts.
- EA-FIX: Check out the details here. Download EA-FIX . EA-FIX is a non-grid HFT scalper.
- EA-GROWTH: High quality low dd EA using trend grids. Download EA_GROWTHJoin Our Telegram Group
")


