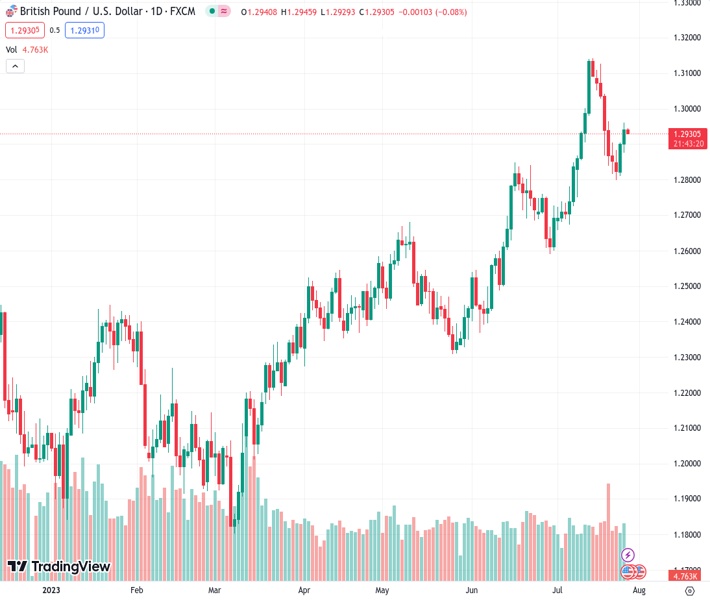
The GBPUSD currency pair, currently at 1.29310, has slightly increased in value as it continues its two-day streak of gains. However, it is expected that there will be limited potential for further upward movement according to the perspective of @nehcap.
…
This is a premium post.
[s2If !current_user_can(access_s2member_level4)]Please register for FREE REGISTER to read full post below containing analysis. In case of any error or you think you are not able to read the full post below, please email us at support#nehcap.com [lwa][/s2If] [s2If current_user_can(access_s2member_level1)]
- GBP/USD edges higher after positing two-day winning streak.
The pair currently trades last at 1.29310.
The previous day high was 1.2905 while the previous day low was 1.281. The daily 38.2% Fib levels comes at 1.2868, expected to provide support. Similarly, the daily 61.8% fib level is at 1.2846, expected to provide support.
GBP/USD bulls take a breather after a two-day uptrend, making rounds to the weekly top surrounding 1.2960 amid the early hours of Thursday’s Asian session. In doing so, the Cable pair portrays the market’s cautious mood ahead of the top-tier data/events, as well as portrays consolidation ahead of the key upside hurdles.
It’s worth noting, however, that the bullish MACD signals and the upbeat RSI (14) line, now overbought, join the GBP/USD pair’s upside break of the 50-SMA to favor the pair buyers.
However, a two-week-old horizontal resistance area surrounding 1.2960-70 guards the immediate upside of the Pound Sterling.
Following that, a convergence of the previous support line stretched from late June and a fortnight-long descending trend line, close to 1.3010 at the latest, will act as the final defense of the GBP/USD pair sellers, a break of which won’t hesitate to challenge the yearly top around 1.3145.
On the flip side, a clear break of the 50-SMA level of around 1.2910 can direct the GBP/USD price toward the 50% Fibonacci retracement of its late June to early July upside, near 1.2865.
Even so, the 200-SMA and 61.8% Fibonacci retracement together could challenge the Cable pair bears around 1.2810-2800.
Overall, GBP/USD stays on the bull’s radar but the road towards the north is long and bumpy.
Elsewhere, the cautious mood ahead of the first readings of the US Gross Domestic Product (GDP) for the second quarter (Q2) and the European Central Bank’s (ECB) monetary policy meeting, as well as US Durable Goods Orders for June, prods the GBP/USD bulls.
Also read: GBP/USD shoots higher as Fed chair sticks to the data dependent script
Trend: limited upside expected
Technical Levels: Supports and Resistances
GBPUSD currently trading at 1.2935 at the time of writing. Pair opened at 1.2903 and is trading with a change of 0.25% % .
| Overview | Overview.1 | |
|---|---|---|
| 0 | Today last price | 1.2935 |
| 1 | Today Daily Change | 0.0032 |
| 2 | Today Daily Change % | 0.25% |
| 3 | Today daily open | 1.2903 |
The pair remains strongly bullish on the daily timeframe. It trades above its 20 SMA @ 1.2857, 50 SMA 1.2673, 100 SMA @ 1.2526 and 200 SMA @ 1.2262.
| Trends | Trends.1 | |
|---|---|---|
| 0 | Daily SMA20 | 1.2857 |
| 1 | Daily SMA50 | 1.2673 |
| 2 | Daily SMA100 | 1.2526 |
| 3 | Daily SMA200 | 1.2262 |
The previous day high was 1.2905 while the previous day low was 1.281. The daily 38.2% Fib levels comes at 1.2868, expected to provide support. Similarly, the daily 61.8% fib level is at 1.2846, expected to provide support.
Note the levels of interest below:
- Pivot support is noted at 1.284, 1.2777, 1.2744
- Pivot resistance is noted at 1.2935, 1.2968, 1.3031
| Levels | Levels.1 |
|---|---|
| Previous Daily High | 1.2905 |
| Previous Daily Low | 1.2810 |
| Previous Weekly High | 1.3126 |
| Previous Weekly Low | 1.2816 |
| Previous Monthly High | 1.2848 |
| Previous Monthly Low | 1.2369 |
| Daily Fibonacci 38.2% | 1.2868 |
| Daily Fibonacci 61.8% | 1.2846 |
| Daily Pivot Point S1 | 1.2840 |
| Daily Pivot Point S2 | 1.2777 |
| Daily Pivot Point S3 | 1.2744 |
| Daily Pivot Point R1 | 1.2935 |
| Daily Pivot Point R2 | 1.2968 |
| Daily Pivot Point R3 | 1.3031 |
[/s2If]
Download Nehcap EAWe have two EAs that are operational on our LIVE accounts.
- EA-FIX: Check out the details here. Download EA-FIX . EA-FIX is a non-grid HFT scalper.
- EA-GROWTH: High quality low dd EA using trend grids. Download EA_GROWTHJoin Our Telegram Group
")


