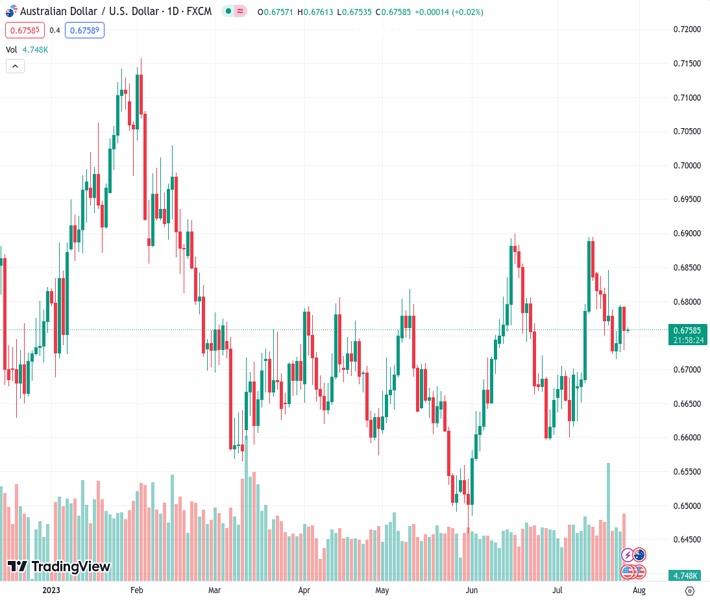
The recovery of #AUDUSD @ 0.67580 loses strength after breaking a two-day winning streak following the Fed’s decision.
…
This is a premium post.
[s2If !current_user_can(access_s2member_level4)]Please register for FREE REGISTER to read full post below containing analysis. In case of any error or you think you are not able to read the full post below, please email us at support#nehcap.com [lwa][/s2If] [s2If current_user_can(access_s2member_level1)]
- AUD/USD fades post-Fed recovery after snapping two-day winning streak.
The pair currently trades last at 0.67580.
The previous day high was 0.6795 while the previous day low was 0.6725. The daily 38.2% Fib levels comes at 0.6768, expected to provide resistance. Similarly, the daily 61.8% fib level is at 0.6752, expected to provide support.
AUD/USD fails to cheer the Federal Reserve’s (Fed) inability to please the US Dollar bulls for long, despite an initial 50 pips jump to 0.6783, as it retreats to 0.6760 amid early Thursday morning in Asia. In doing so, the Aussie pair traders seem to convey their dovish bias about the Reserve Bank of Australia (RBA) after the previous day’s downbeat inflation data. Also weighing on the risk-barometer pair could be the market’s cautious mood ahead of the top-tier US data and mixed headlines about China.
Federal Reserve (Fed) matched the widely forecasted increase of 25 basis points (bps) to the benchmark Fed rates toward the multi-year high in the range of 5.25%-5.50%. Following the rate decision, Fed Chairman Jerome Powell tried to placate the hawks by showing readiness for a September rate hike as he said, that the June inflation Consumer Price Index was welcomed but “was only one month’s report.” It should be noted that the rejection of recession fears was also an effort to please the US Dollar buyers but failed.
On the other hand, Australia’s headline Consumer Price Index (CPI) for the second quarter (Q2) of 2023 drops to 0.8% QoQ versus 1.0% expected and 1.4% prior while the Reserve Bank of Australia (RBA) Trimmed Mean CPI came in as 1.0% compared to 1.1% market forecasts and 1.2% prior for the said period. Further, the Monthly CPI matches 5.4% analysts’ expectations for June versus 5.6% prior.
Following the downbeat Aussie inflation data, Australian Treasurer Jim Chalmers praised the direction but also added that there is a long way to go to beat inflation.”
Elsewhere, fresh challenges to the US-China ties, due to Washington’s push for a law to keep China investments from US companies in check, also seem to tease the AUD/USD bears of late.
Amid these plays, Wall Street benchmarks edged lower while the US 10-year Treasury bond yields marked the first daily loss in three by closing around 3.87%. That said, the US Dollar Index (DXY) also declined and marked a two-day losing streak before posting lackluster moves of late.
Looking ahead, the second-quarter (Q2) Export Price Index and Import Price Index from Australia will be closely examined for more clues about inflation and the next RBA move. Following that, the advance readings of the US Q2 GDP Annualized, expected to ease to 1.8% from 2.0%, as well as the Durable Goods Orders for June, likely easing to 1.0% from 1.8% prior (revised), will be eyed for clear directions. It should be noted that the European Central Bank (ECB) monetary policy meeting will also affect the US Dollar and hence should be watched for a clear guide.
A clear U-turn from a fortnight-old resistance line, near 0.6785 by the press time, directs AUD/USD toward a three-week-old rising trend line, close to 0.6740 at the latest.
Technical Levels: Supports and Resistances
AUDUSD currently trading at 0.676 at the time of writing. Pair opened at 0.6792 and is trading with a change of -0.47% % .
| Overview | Overview.1 | |
|---|---|---|
| 0 | Today last price | 0.676 |
| 1 | Today Daily Change | -0.0032 |
| 2 | Today Daily Change % | -0.47% |
| 3 | Today daily open | 0.6792 |
The pair remains strongly bullish on the daily timeframe. It trades above its 20 SMA @ 0.6727, 50 SMA 0.6695, 100 SMA @ 0.6689 and 200 SMA @ 0.6723.
| Trends | Trends.1 | |
|---|---|---|
| 0 | Daily SMA20 | 0.6727 |
| 1 | Daily SMA50 | 0.6695 |
| 2 | Daily SMA100 | 0.6689 |
| 3 | Daily SMA200 | 0.6723 |
The previous day high was 0.6795 while the previous day low was 0.6725. The daily 38.2% Fib levels comes at 0.6768, expected to provide resistance. Similarly, the daily 61.8% fib level is at 0.6752, expected to provide support.
Note the levels of interest below:
- Pivot support is noted at 0.6747, 0.6701, 0.6677
- Pivot resistance is noted at 0.6816, 0.684, 0.6886
| Levels | Levels.1 |
|---|---|
| Previous Daily High | 0.6795 |
| Previous Daily Low | 0.6725 |
| Previous Weekly High | 0.6854 |
| Previous Weekly Low | 0.6722 |
| Previous Monthly High | 0.6900 |
| Previous Monthly Low | 0.6484 |
| Daily Fibonacci 38.2% | 0.6768 |
| Daily Fibonacci 61.8% | 0.6752 |
| Daily Pivot Point S1 | 0.6747 |
| Daily Pivot Point S2 | 0.6701 |
| Daily Pivot Point S3 | 0.6677 |
| Daily Pivot Point R1 | 0.6816 |
| Daily Pivot Point R2 | 0.6840 |
| Daily Pivot Point R3 | 0.6886 |
[/s2If]
Download Nehcap EAWe have two EAs that are operational on our LIVE accounts.
- EA-FIX: Check out the details here. Download EA-FIX . EA-FIX is a non-grid HFT scalper.
- EA-GROWTH: High quality low dd EA using trend grids. Download EA_GROWTHJoin Our Telegram Group
")


