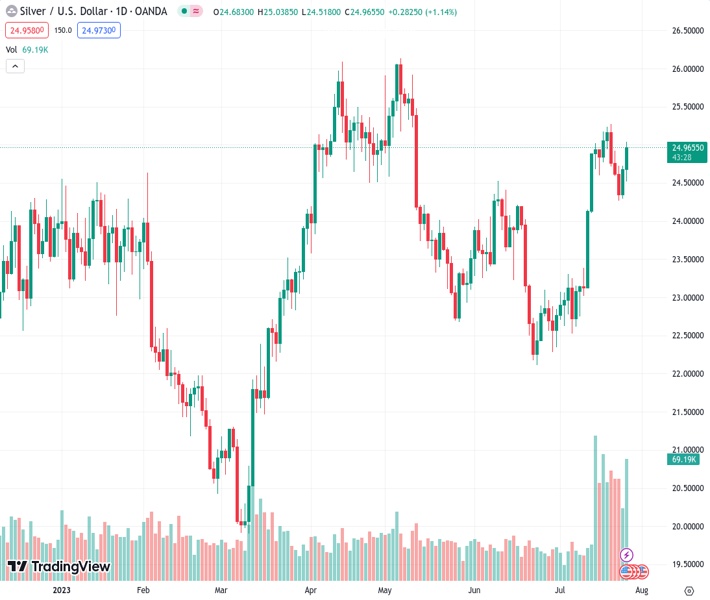
The XAGUSD pair moved up to $24.90, marking its highest level in six days.
…
This is a premium post.
[s2If !current_user_can(access_s2member_level4)]Please register for FREE REGISTER to read full post below containing analysis. In case of any error or you think you are not able to read the full post below, please email us at support#nehcap.com [lwa][/s2If] [s2If current_user_can(access_s2member_level1)]
- XAG/USD jumped towards $24.90, its highest in six days.
The pair currently trades last at 24.964.
The previous day high was 24.73 while the previous day low was 24.3. The daily 38.2% Fib levels comes at 24.56, expected to provide support. Similarly, the daily 61.8% fib level is at 24.46, expected to provide support.
In the middle of the week, the XAG/USD pair is trading strong, showing 0.88% of gains so far this day. As the market expected, the Federal Reserve (Fed) effectively raised the interest rate by 25 basis points. Fed’s Chair Jerom Powell emphasized that “a rate hike in September is possible, but also stated that it is possible not to raise rates”. Powell also highlighted the importance of ‘meeting by meeting’ as the following decisions will be based on the data that comes out.
Following this, US treasury yields on 2, 5 and 10-year bonds which could be seen as the opportunity cost of holding precious metals, are trading lower at 4.82%, 4.09% and 3.85%, respectively. Additionally, the DXY index is losing ground at 0.30% below 101.00.
According to the daily chart, there is a strong bullish momentum. The Relative Strength Index (RSI) with a slightly upward slope to the north, while the Moving Average Convergence Divergence (MACD) index prints smooth green bars indicating a favourable momentum for the bulls in the market. On the bigger picture, the metal is trading above the 20,100 and 200-day Simple Moving Averages (SMA)suggesting that bulls are in command.
Resistance levels: 25.00, 25.30, 25.50
Support levels: 24.50, 23.98 (20-day SMA), 23.84 (100-day SMA).
Technical Levels: Supports and Resistances
XAGUSD currently trading at 24.98 at the time of writing. Pair opened at 24.68 and is trading with a change of 1.22 % .
| Overview | Overview.1 | |
|---|---|---|
| 0 | Today last price | 24.98 |
| 1 | Today Daily Change | 0.30 |
| 2 | Today Daily Change % | 1.22 |
| 3 | Today daily open | 24.68 |
The pair remains strongly bullish on the daily timeframe. It trades above its 20 SMA @ 23.82, 50 SMA 23.6, 100 SMA @ 23.79 and 200 SMA @ 22.97.
| Trends | Trends.1 | |
|---|---|---|
| 0 | Daily SMA20 | 23.82 |
| 1 | Daily SMA50 | 23.60 |
| 2 | Daily SMA100 | 23.79 |
| 3 | Daily SMA200 | 22.97 |
The previous day high was 24.73 while the previous day low was 24.3. The daily 38.2% Fib levels comes at 24.56, expected to provide support. Similarly, the daily 61.8% fib level is at 24.46, expected to provide support.
Note the levels of interest below:
- Pivot support is noted at 24.41, 24.14, 23.98
- Pivot resistance is noted at 24.84, 25.0, 25.27
| Levels | Levels.1 |
|---|---|
| Previous Daily High | 24.73 |
| Previous Daily Low | 24.30 |
| Previous Weekly High | 25.27 |
| Previous Weekly Low | 24.59 |
| Previous Monthly High | 24.53 |
| Previous Monthly Low | 22.11 |
| Daily Fibonacci 38.2% | 24.56 |
| Daily Fibonacci 61.8% | 24.46 |
| Daily Pivot Point S1 | 24.41 |
| Daily Pivot Point S2 | 24.14 |
| Daily Pivot Point S3 | 23.98 |
| Daily Pivot Point R1 | 24.84 |
| Daily Pivot Point R2 | 25.00 |
| Daily Pivot Point R3 | 25.27 |
[/s2If]
Download Nehcap EAWe have two EAs that are operational on our LIVE accounts.
- EA-FIX: Check out the details here. Download EA-FIX . EA-FIX is a non-grid HFT scalper.
- EA-GROWTH: High quality low dd EA using trend grids. Download EA_GROWTHJoin Our Telegram Group
")


