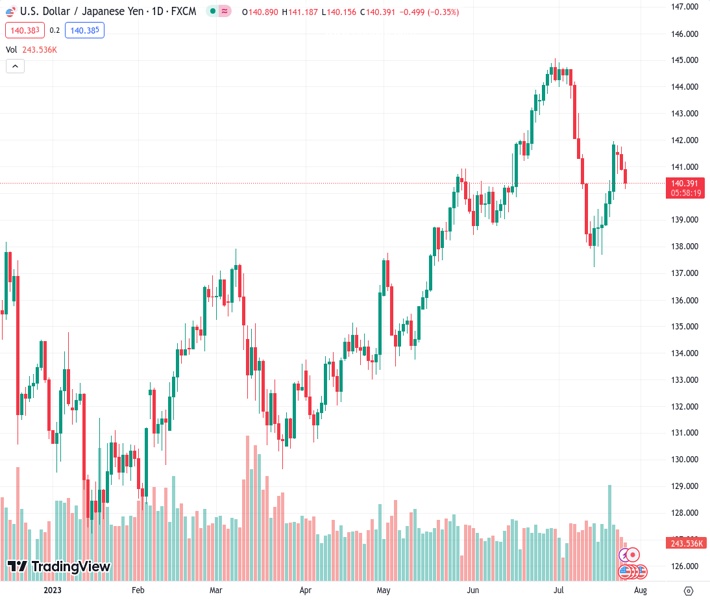
The USDJPY exchange rate at 140.371 has experienced a decline for the third day in a row, reaching levels close to 140.40.
…
This is a premium post.
[s2If !current_user_can(access_s2member_level4)]Please register for FREE REGISTER to read full post below containing analysis. In case of any error or you think you are not able to read the full post below, please email us at support#nehcap.com [lwa][/s2If] [s2If current_user_can(access_s2member_level1)]
- USD/JPY tallies a third consecutive day of losses towards the 140.40 area.
The pair currently trades last at 140.371.
The previous day high was 141.75 while the previous day low was 140.85. The daily 38.2% Fib levels comes at 141.2, expected to provide resistance. Similarly, the daily 61.8% fib level is at 141.41, expected to provide resistance.
On Wednesday, the JPY gained ground agains most of its rivals, and the USD/JPY pair declined towards 140.40. The USD trades soft ahead of the Federal Reserve (Fed) decision later in the session, while the Yen strengthened on the back of a possible surprise of the Bank of Japan (BoJ) on Friday.
Ahead of the Federal Reserve (Fed) decision later in the session, the USD is falling, and US Treasury yields are backing down. Markets have already priced in a 25 basis point (bps) hike and are betting on 20% odds of a similar hike in September and then on 45% probabilities in November. As there won’t be any updated macro forecast or dot plot, messaging regarding forward guidance will be key for investors modelling their expectations for the next meetings.
On the other hand, markets have been receiving mixed signals regarding the next BoJ decision in the last sessions. Masato Kanda, a top currency Japanese diplomat, suggested that a Yield Control Curve (YCC) is highly possible. At the same time, BoJ’s Governor Kazuo Ueda was quoted as saying that the bank will maintain its accommodative approach. While the BoJ has a history of surprising markets, the broad consensus is that it will hold its policy unchanged, but markets seem to be pricing in a possibility of a pivot.
The USD/JPY technical outlook, according to the daily chart suggests a neutral to bullish outlook for the short term. On the one hand, indicators give mixed signals, with the Relative Strength Index (RSI) falling below it midline while the Moving Average Convergence Divergence (MACD) prints fading red bars. On the other, the pair trades above the 100 and 200-day Simple Moving Average (SMA), which suggests that the buyers are overall in command, but the Fed’s decision will dictate the short-term trajectory.
Support levels: 140.00,139.10,138.70.
Resistance levels: 141.58 (20-day SMA), 142.00, 143.00.
Technical Levels: Supports and Resistances
USDJPY currently trading at 140.42 at the time of writing. Pair opened at 140.91 and is trading with a change of -0.35 % .
| Overview | Overview.1 | |
|---|---|---|
| 0 | Today last price | 140.42 |
| 1 | Today Daily Change | -0.49 |
| 2 | Today Daily Change % | -0.35 |
| 3 | Today daily open | 140.91 |
The pair is trading below its 20 Daily moving average @ 141.6, below its 50 Daily moving average @ 140.83 , above its 100 Daily moving average @ 137.29 and above its 200 Daily moving average @ 136.83
| Trends | Trends.1 | |
|---|---|---|
| 0 | Daily SMA20 | 141.60 |
| 1 | Daily SMA50 | 140.83 |
| 2 | Daily SMA100 | 137.29 |
| 3 | Daily SMA200 | 136.83 |
The previous day high was 141.75 while the previous day low was 140.85. The daily 38.2% Fib levels comes at 141.2, expected to provide resistance. Similarly, the daily 61.8% fib level is at 141.41, expected to provide resistance.
Note the levels of interest below:
- Pivot support is noted at 140.59, 140.28, 139.7
- Pivot resistance is noted at 141.48, 142.06, 142.38
| Levels | Levels.1 |
|---|---|
| Previous Daily High | 141.75 |
| Previous Daily Low | 140.85 |
| Previous Weekly High | 141.96 |
| Previous Weekly Low | 137.68 |
| Previous Monthly High | 145.07 |
| Previous Monthly Low | 138.43 |
| Daily Fibonacci 38.2% | 141.20 |
| Daily Fibonacci 61.8% | 141.41 |
| Daily Pivot Point S1 | 140.59 |
| Daily Pivot Point S2 | 140.28 |
| Daily Pivot Point S3 | 139.70 |
| Daily Pivot Point R1 | 141.48 |
| Daily Pivot Point R2 | 142.06 |
| Daily Pivot Point R3 | 142.38 |
[/s2If]
Download Nehcap EAWe have two EAs that are operational on our LIVE accounts.
- EA-FIX: Check out the details here. Download EA-FIX . EA-FIX is a non-grid HFT scalper.
- EA-GROWTH: High quality low dd EA using trend grids. Download EA_GROWTHJoin Our Telegram Group
")


