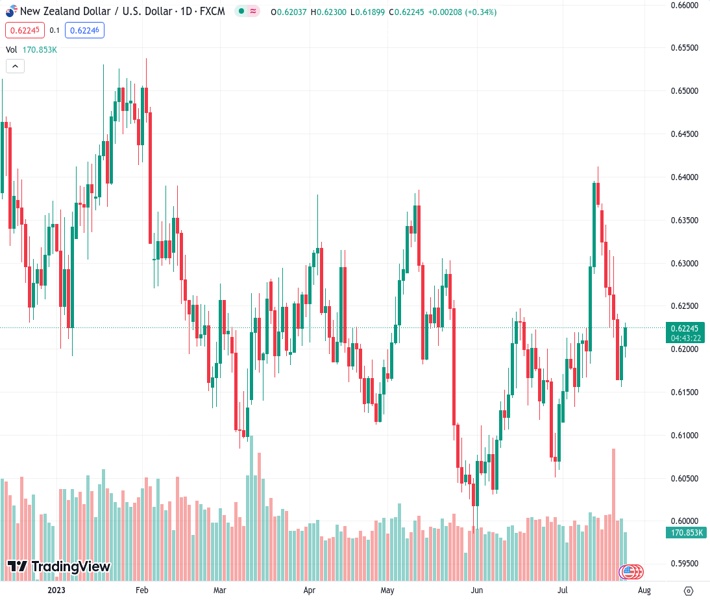
The New Zealand dollar against the US dollar reached a level above 0.6200, even though the US dollar remained strong.
…
This is a premium post.
[s2If !current_user_can(access_s2member_level4)]Please register for FREE REGISTER to read full post below containing analysis. In case of any error or you think you are not able to read the full post below, please email us at support#nehcap.com [lwa][/s2If] [s2If current_user_can(access_s2member_level1)]
- The NZD/USD rose above 0.6200 despite the USD holding its foot.
The pair currently trades last at 0.62253.
The previous day high was 0.6216 while the previous day low was 0.6156. The daily 38.2% Fib levels comes at 0.6193, expected to provide support. Similarly, the daily 61.8% fib level is at 0.6179, expected to provide support.
On Tuesday, the NZD/USD escalated higher despite the USD trading resilient against most of its partners. Ahead of Wednesday’s Federal Reserve (Fed) decision, the US reported robust data which could limit the pair’s upside. On the Kiwi’s side, the NZD seem to be strengthening on the Chinese announcement of an economic support package that would benefit the Asian block.
The US reported solid Housing and Consumer Confidence data from July. The Conference Board reported that individuals’ confidence in economic activity jumped to 117, above the expected 112 and the previous 109.7. On the other hand, the S&P/Case-Shiller Home Price Index dropped but was lower than expected in May, coming falling by 1.7% vs -2.2% expected, while the Federal Housing Agency reported that its Housing Price Index increased by 0.7% in the same month, beating the consensus of 0.2%.
Ahead of the Federal Reserve (Fed) two-day meeting, markets await a 25 basis point (bps) hike and data-dependant approach by Chair Powell, as a robust economy and a tight labour market may make the Federal Open Market Committee consider another hike in September.
In the meantime, the USD DXY Index continued to rise to 101.60 but then retreated towards 101.40, still holding gains while US Treasury yields traded mixed, with the 2-year rate slightly decreased to 4.90%.
The outlook is tilted to the downside despite the pair tallying a two-day winning strike, according to the daily chart. The Relative Strength Index (RSI) stands below its midline while the Moving Average Convergence (MACD) prints rising red bars. However, if the bulls manage to hold above the 20 and 100-day Simple Moving Average (SMA) convergence above 0.6200, more upside may be on the horizon.
Resistance levels: 0.6230, 0.6250, 0.6270.
Support levels: 0.6200, 0.6190 (100-day SMA), 0.6150.
Technical Levels: Supports and Resistances
NZDUSD currently trading at 0.6219 at the time of writing. Pair opened at 0.6204 and is trading with a change of 0.24 % .
| Overview | Overview.1 | |
|---|---|---|
| 0 | Today last price | 0.6219 |
| 1 | Today Daily Change | 0.0015 |
| 2 | Today Daily Change % | 0.2400 |
| 3 | Today daily open | 0.6204 |
The pair remains strongly bullish on the daily timeframe. It trades above its 20 SMA @ 0.6212, 50 SMA 0.6169, 100 SMA @ 0.6195 and 200 SMA @ 0.6209.
| Trends | Trends.1 | |
|---|---|---|
| 0 | Daily SMA20 | 0.6212 |
| 1 | Daily SMA50 | 0.6169 |
| 2 | Daily SMA100 | 0.6195 |
| 3 | Daily SMA200 | 0.6209 |
The previous day high was 0.6216 while the previous day low was 0.6156. The daily 38.2% Fib levels comes at 0.6193, expected to provide support. Similarly, the daily 61.8% fib level is at 0.6179, expected to provide support.
Note the levels of interest below:
- Pivot support is noted at 0.6168, 0.6132, 0.6108
- Pivot resistance is noted at 0.6228, 0.6252, 0.6288
| Levels | Levels.1 |
|---|---|
| Previous Daily High | 0.6216 |
| Previous Daily Low | 0.6156 |
| Previous Weekly High | 0.6370 |
| Previous Weekly Low | 0.6163 |
| Previous Monthly High | 0.6250 |
| Previous Monthly Low | 0.5990 |
| Daily Fibonacci 38.2% | 0.6193 |
| Daily Fibonacci 61.8% | 0.6179 |
| Daily Pivot Point S1 | 0.6168 |
| Daily Pivot Point S2 | 0.6132 |
| Daily Pivot Point S3 | 0.6108 |
| Daily Pivot Point R1 | 0.6228 |
| Daily Pivot Point R2 | 0.6252 |
| Daily Pivot Point R3 | 0.6288 |
[/s2If]
Download Nehcap EAWe have two EAs that are operational on our LIVE accounts.
- EA-FIX: Check out the details here. Download EA-FIX . EA-FIX is a non-grid HFT scalper.
- EA-GROWTH: High quality low dd EA using trend grids. Download EA_GROWTHJoin Our Telegram Group
")


