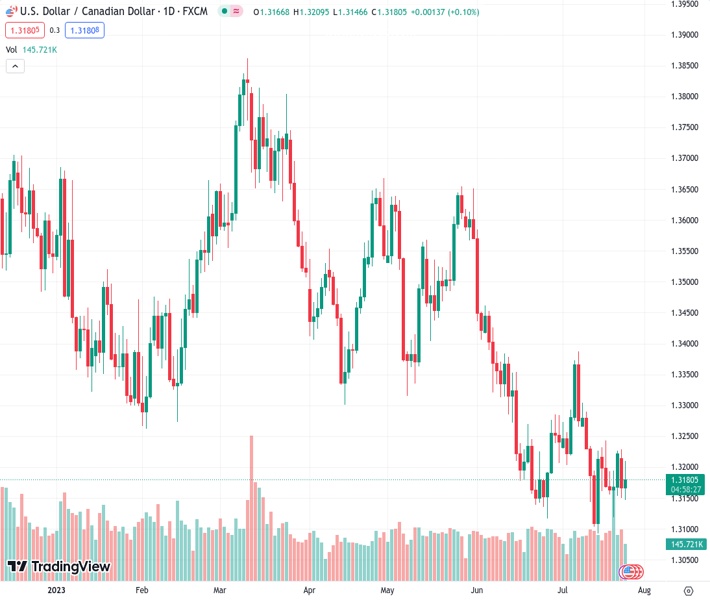
Despite rebounding by 0.78% from its lowest point so far this year at 1.3092, the USDCAD exchange rate remains below the intermediate resistance level of 1.3243.
…
This is a premium post.
[s2If !current_user_can(access_s2member_level4)]Please register for FREE REGISTER to read full post below containing analysis. In case of any error or you think you are not able to read the full post below, please email us at support#nehcap.com [lwa][/s2If] [s2If current_user_can(access_s2member_level1)]
- Despite a recovery of 0.78% from its year-to-date (YTD) low of 1.3092, the USD/CAD remains below the intermediate resistance level of 1.3243.
The pair currently trades last at 1.31800.
The previous day high was 1.3229 while the previous day low was 1.315. The daily 38.2% Fib levels comes at 1.318, expected to provide resistance. Similarly, the daily 61.8% fib level is at 1.3199, expected to provide resistance.
USD/CAD recovers some ground during the North American session, up 0.20% but is struggling to break above solid resistance levels, impeding the pair from conquering the 1.3200 figure. The USD/CAD is trading at 1.3192 after hitting a daily low of 1.3146.
The USD/CAD daily chart portrays the pair as downward biased. However, since reaching a new year-to-date (YTD) low of 1.3092 on July 14, it enjoyed a recovery of 0.78%. Yet, it remains below the July 18 swing high of 1.3243, which is seen as an intermediate resistance level that, once broken, could pave the way for further upside.
If the above scenario plays out, the first resistance would be the 50-day Exponential Moving Average (EMA) at 1.3293 before breaking 1.3300 on its way to the confluence of the 200 and 100-day EMAs at 1.3362/1.3366. Upside risks lie at 1.3400.
Nevertheless, the path of least resistance for the USD/CAD is downwards, cushioned on the upside by the 20-day EMA at 1.3214. That said, the USD/CAD first support would be the weekly low of 1.3146, followed by the July 20 swing low of 1.3119. A breach of the latter will expose the YTD low of 1.3092.
Technical Levels: Supports and Resistances
USDCAD currently trading at 1.3193 at the time of writing. Pair opened at 1.3168 and is trading with a change of 0.19 % .
| Overview | Overview.1 | |
|---|---|---|
| 0 | Today last price | 1.3193 |
| 1 | Today Daily Change | 0.0025 |
| 2 | Today Daily Change % | 0.1900 |
| 3 | Today daily open | 1.3168 |
The pair remains strongly bearish on the daily time frame. It trades below the 20 SMA @ 1.3223, 50 SMA 1.3327, 100 SMA @ 1.3447 and 200 SMA @ 1.3474.
| Trends | Trends.1 | |
|---|---|---|
| 0 | Daily SMA20 | 1.3223 |
| 1 | Daily SMA50 | 1.3327 |
| 2 | Daily SMA100 | 1.3447 |
| 3 | Daily SMA200 | 1.3474 |
The previous day high was 1.3229 while the previous day low was 1.315. The daily 38.2% Fib levels comes at 1.318, expected to provide resistance. Similarly, the daily 61.8% fib level is at 1.3199, expected to provide resistance.
Note the levels of interest below:
- Pivot support is noted at 1.3136, 1.3104, 1.3057
- Pivot resistance is noted at 1.3214, 1.3261, 1.3293
| Levels | Levels.1 |
|---|---|
| Previous Daily High | 1.3229 |
| Previous Daily Low | 1.3150 |
| Previous Weekly High | 1.3244 |
| Previous Weekly Low | 1.3120 |
| Previous Monthly High | 1.3585 |
| Previous Monthly Low | 1.3117 |
| Daily Fibonacci 38.2% | 1.3180 |
| Daily Fibonacci 61.8% | 1.3199 |
| Daily Pivot Point S1 | 1.3136 |
| Daily Pivot Point S2 | 1.3104 |
| Daily Pivot Point S3 | 1.3057 |
| Daily Pivot Point R1 | 1.3214 |
| Daily Pivot Point R2 | 1.3261 |
| Daily Pivot Point R3 | 1.3293 |
[/s2If]
Download Nehcap EAWe have two EAs that are operational on our LIVE accounts.
- EA-FIX: Check out the details here. Download EA-FIX . EA-FIX is a non-grid HFT scalper.
- EA-GROWTH: High quality low dd EA using trend grids. Download EA_GROWTHJoin Our Telegram Group
")


