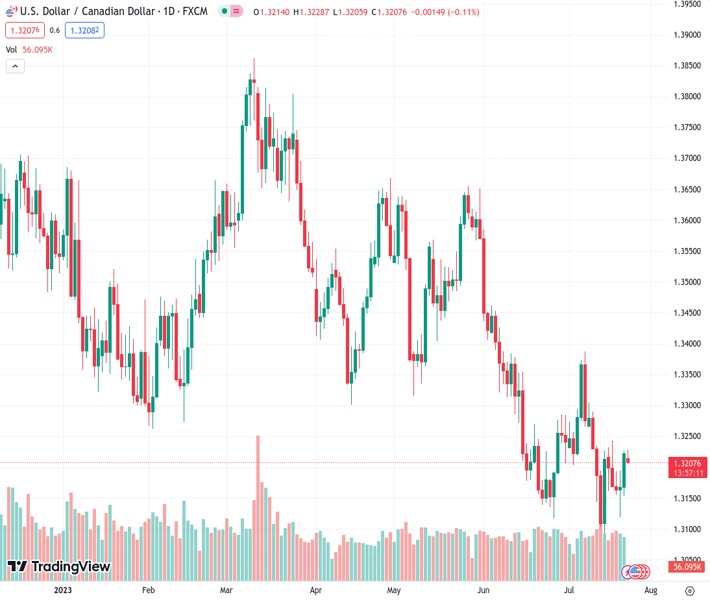
The currency pair of USDCAD is currently trading at 1.32105 and is staying within a tight range centered around 1.3220.
…
This is a premium post.
[s2If !current_user_can(access_s2member_level4)]Please register for FREE REGISTER to read full post below containing analysis. In case of any error or you think you are not able to read the full post below, please email us at support#nehcap.com [lwa][/s2If] [s2If current_user_can(access_s2member_level1)]
- USD/CAD remains confined in a narrow trading band around 1.3220.
The pair currently trades last at 1.32105.
The previous day high was 1.3226 while the previous day low was 1.3153. The daily 38.2% Fib levels comes at 1.3198, expected to provide support. Similarly, the daily 61.8% fib level is at 1.3181, expected to provide support.
The USD/CAD pair oscillates in a narrow trading band near 1.3220 heading into the European session on Monday. In response to Friday’s release of Canadian Retail Sales, the Loonie declines against the US Dollar. During the busy week of economic data, market participants remain on the sidelines, awaiting the Federal Reserve’s (Fed) interest rate announcement for fresh impetus for the USD/CAD pair.
Meanwhile, the renewed tension between Russia and Ukraine might further tighten oil supplies. This, in turn, might cap the upside in the USD/CAD pair and lift the commodity-linked Loonie.
From the technical perspective, USD/CAD holds above the 50- and 100-hour Exponential Moving Averages (EMA), which means further upside looks favorable.
Therefore, the major pair could meet the immediate resistance level of 1.3230 (High of July 24) en route to 1.3245 (High of July 18). The 1.3290–1.3300 zone appears to be a tough nut to crack for USD/JPY. Any meaningful follow-through buying above the latter will see a rally to the next barrier at 1.3320 (High of June 14).
That said, the Relative Strength Index (RSI) stands above 50, within bullish territory, suggesting that buyers are likely to retain control in the near term.
Looking at the downside, any extended weakness below the 1.3200 mark will challenge the next contention at 1.3185 (the 100-hour EMA). Further south, the pair will see a drop to 1.3150 (Low of July 21).
Technical Levels: Supports and Resistances
USDCAD currently trading at 1.3219 at the time of writing. Pair opened at 1.3223 and is trading with a change of -0.03 % .
| Overview | Overview.1 | |
|---|---|---|
| 0 | Today last price | 1.3219 |
| 1 | Today Daily Change | -0.0004 |
| 2 | Today Daily Change % | -0.0300 |
| 3 | Today daily open | 1.3223 |
The pair remains strongly bearish on the daily time frame. It trades below the 20 SMA @ 1.3223, 50 SMA 1.3333, 100 SMA @ 1.3451 and 200 SMA @ 1.3476.
| Trends | Trends.1 | |
|---|---|---|
| 0 | Daily SMA20 | 1.3223 |
| 1 | Daily SMA50 | 1.3333 |
| 2 | Daily SMA100 | 1.3451 |
| 3 | Daily SMA200 | 1.3476 |
The previous day high was 1.3226 while the previous day low was 1.3153. The daily 38.2% Fib levels comes at 1.3198, expected to provide support. Similarly, the daily 61.8% fib level is at 1.3181, expected to provide support.
Note the levels of interest below:
- Pivot support is noted at 1.3175, 1.3128, 1.3102
- Pivot resistance is noted at 1.3249, 1.3274, 1.3322
| Levels | Levels.1 |
|---|---|
| Previous Daily High | 1.3226 |
| Previous Daily Low | 1.3153 |
| Previous Weekly High | 1.3244 |
| Previous Weekly Low | 1.3120 |
| Previous Monthly High | 1.3585 |
| Previous Monthly Low | 1.3117 |
| Daily Fibonacci 38.2% | 1.3198 |
| Daily Fibonacci 61.8% | 1.3181 |
| Daily Pivot Point S1 | 1.3175 |
| Daily Pivot Point S2 | 1.3128 |
| Daily Pivot Point S3 | 1.3102 |
| Daily Pivot Point R1 | 1.3249 |
| Daily Pivot Point R2 | 1.3274 |
| Daily Pivot Point R3 | 1.3322 |
[/s2If]
Download Nehcap EAWe have two EAs that are operational on our LIVE accounts.
- EA-FIX: Check out the details here. Download EA-FIX . EA-FIX is a non-grid HFT scalper.
- EA-GROWTH: High quality low dd EA using trend grids. Download EA_GROWTHJoin Our Telegram Group
")


