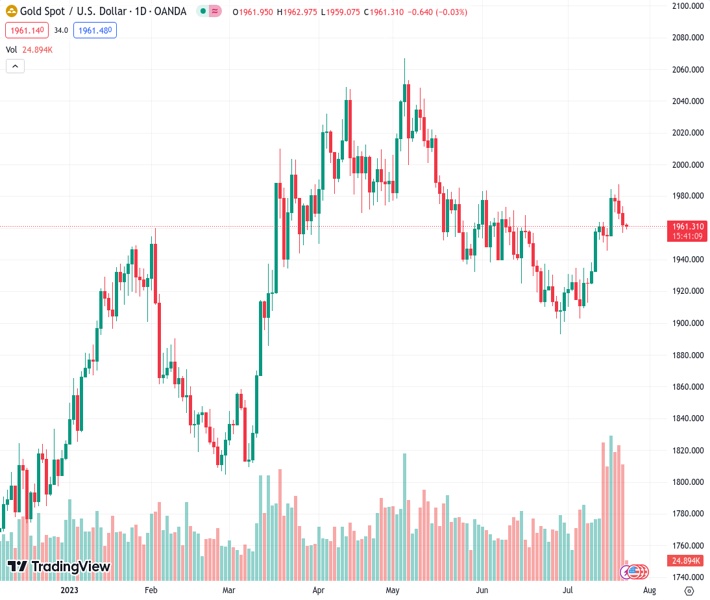
The price of gold, indicated by #XAUUSD at 1,961.13, continues to experience downward pressure but manages to stay above the $1,960 mark on Monday.
…
This is a premium post.
[s2If !current_user_can(access_s2member_level4)]Please register for FREE REGISTER to read full post below containing analysis. In case of any error or you think you are not able to read the full post below, please email us at support#nehcap.com [lwa][/s2If] [s2If current_user_can(access_s2member_level1)]
- Gold price remains pressured and holds above the $1,960 level on Monday.
The pair currently trades last at 1961.13.
The previous day high was 1973.84 while the previous day low was 1956.88. The daily 38.2% Fib levels comes at 1963.36, expected to provide resistance. Similarly, the daily 61.8% fib level is at 1967.36, expected to provide resistance.
Gold price struggles to gain traction during the Asian session on Monday. The XAU/USD currently trades just below the $1,960 level, down 0.11% for the day. Market players await the Federal Open Market Committee (FOMC) meeting and Fed Chairman Jerome Powell’s press conference. These events could significantly impact the USD-denominated gold price.
The Federal Reserve (Fed) will announce the outcome of its monetary policy meeting on Wednesday, and market participants expect the Fed to raise interest rates by 25 basis points (bps). The possibility of another Fed rate hike after the July meeting increased to 28% from 15.9% last month, according to the CME FedWatch Tool. That said, the prospects of additional Fed and ECB policy tightening might be another factor capping the upside for the non-yielding gold price.
Looking at the one-hour chart, a break below the lower limit of the Bollinger Band at $1,950 will see a drop towards $1,940 (High of July 12) en route to $1,930 and $1,920 (High of July 3). In case the selling pressure remains, the pair would see the critical contention at $1,900, a psychological round mark.
On the upside, the immediate resistance level is seen at $1,965, representing the upper boundary of the Bollinger Band. A decisive break above the latter would drive gold towards $1,972 (High of July 21), followed by $1,983 (High of July 18). The additional upside filter is $2,000.
It’s worth noting that the 50-hour Exponential Moving Average (EMA) is on the verge of crossing below the 100-hour EMA. If a decisive crossover occurs on the one-hour chart, It would validate a Bear Cross, highlighting that the path of least resistance for gold is to the downside.
Technical Levels: Supports and Resistances
XAUUSD currently trading at 1960.66 at the time of writing. Pair opened at 1961.84 and is trading with a change of -0.06 % .
| Overview | Overview.1 | |
|---|---|---|
| 0 | Today last price | 1960.66 |
| 1 | Today Daily Change | -1.18 |
| 2 | Today Daily Change % | -0.06 |
| 3 | Today daily open | 1961.84 |
The pair is trading above its 20 Daily moving average @ 1937.15, above its 50 Daily moving average @ 1949.11 , below its 100 Daily moving average @ 1960.77 and above its 200 Daily moving average @ 1879.77
| Trends | Trends.1 | |
|---|---|---|
| 0 | Daily SMA20 | 1937.15 |
| 1 | Daily SMA50 | 1949.11 |
| 2 | Daily SMA100 | 1960.77 |
| 3 | Daily SMA200 | 1879.77 |
The previous day high was 1973.84 while the previous day low was 1956.88. The daily 38.2% Fib levels comes at 1963.36, expected to provide resistance. Similarly, the daily 61.8% fib level is at 1967.36, expected to provide resistance.
Note the levels of interest below:
- Pivot support is noted at 1954.53, 1947.23, 1937.57
- Pivot resistance is noted at 1971.49, 1981.15, 1988.45
| Levels | Levels.1 |
|---|---|
| Previous Daily High | 1973.84 |
| Previous Daily Low | 1956.88 |
| Previous Weekly High | 1987.54 |
| Previous Weekly Low | 1945.85 |
| Previous Monthly High | 1983.50 |
| Previous Monthly Low | 1893.01 |
| Daily Fibonacci 38.2% | 1963.36 |
| Daily Fibonacci 61.8% | 1967.36 |
| Daily Pivot Point S1 | 1954.53 |
| Daily Pivot Point S2 | 1947.23 |
| Daily Pivot Point S3 | 1937.57 |
| Daily Pivot Point R1 | 1971.49 |
| Daily Pivot Point R2 | 1981.15 |
| Daily Pivot Point R3 | 1988.45 |
[/s2If]
Download Nehcap EAWe have two EAs that are operational on our LIVE accounts.
- EA-FIX: Check out the details here. Download EA-FIX . EA-FIX is a non-grid HFT scalper.
- EA-GROWTH: High quality low dd EA using trend grids. Download EA_GROWTHJoin Our Telegram Group
")


