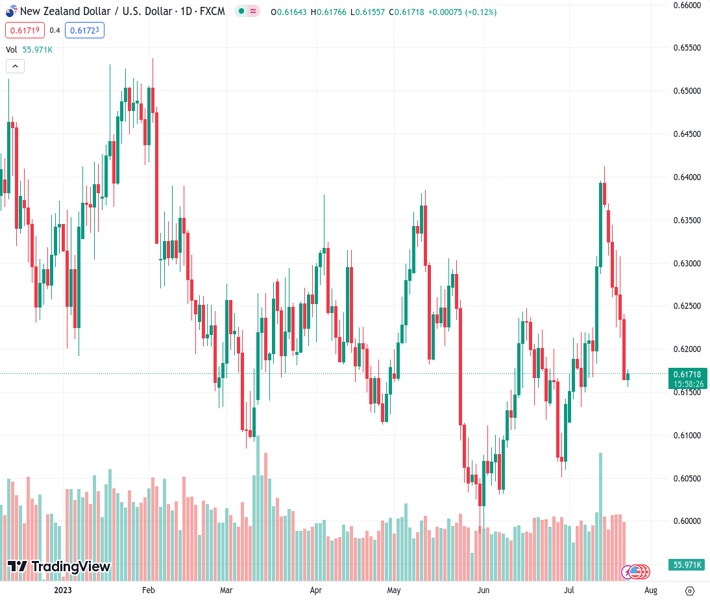
The NZDUSD currency pair is facing difficulties in maintaining its rebound from a two-week low at a price of 0.61701. According to the perspective of Nehcap, it is anticipated that the pair will continue to decline.
…
This is a premium post.
[s2If !current_user_can(access_s2member_level4)]Please register for FREE REGISTER to read full post below containing analysis. In case of any error or you think you are not able to read the full post below, please email us at support#nehcap.com [lwa][/s2If] [s2If current_user_can(access_s2member_level1)]
- NZD/USD struggles to defend the corrective bounce off two-week low.
The pair currently trades last at 0.61701.
The previous day high was 0.6242 while the previous day low was 0.6163. The daily 38.2% Fib levels comes at 0.6193, expected to provide resistance. Similarly, the daily 61.8% fib level is at 0.6212, expected to provide resistance.
NZD/USD remains pressured at the lowest level in two weeks around 0.6165 heading into Monday’s European session. In doing so, Kiwi pair sellers justify the oversold RSI while probing bears during a seven-day losing streak.
However, the quote’s sustained trading below the previously important key technical supports keeps the sellers hopeful as market players await the key US PMIs for intraday directions.
That said, a clear downside break of the previous support line from July 06 and the 200-SMA joins the bearish MACD signals to keep the NZD/USD seller hopeful.
Even if the NZD/USD price manages to cross the stated key moving average and the support-turned-resistance, respectively near 0.6200 and 0.6260, a one-week-old horizontal resistance area surrounding 0.6300-6310 will act as the last defense of the bears.
On the contrary, the 61.8% Fibonacci retracement of the May-July upside, near 0.6150, restricts the immediate downside of the NZD/USD pair ahead of a seven-week-old rising support line, close to the 0.6100 round figure at the latest.
Following that, the late June swing low near 0.6050 and the 0.6000 round figure will be in the spotlight.
Overall, the Kiwi bears are likely to keep the reins despite the latest corrective bounce.
Trend: Further downside expected
Technical Levels: Supports and Resistances
NZDUSD currently trading at 0.6169 at the time of writing. Pair opened at 0.6168 and is trading with a change of 0.02% % .
| Overview | Overview.1 | |
|---|---|---|
| 0 | Today last price | 0.6169 |
| 1 | Today Daily Change | 0.0001 |
| 2 | Today Daily Change % | 0.02% |
| 3 | Today daily open | 0.6168 |
The pair remains strongly bearish on the daily time frame. It trades below the 20 SMA @ 0.621, 50 SMA 0.617, 100 SMA @ 0.6195 and 200 SMA @ 0.6206.
| Trends | Trends.1 | |
|---|---|---|
| 0 | Daily SMA20 | 0.6210 |
| 1 | Daily SMA50 | 0.6170 |
| 2 | Daily SMA100 | 0.6195 |
| 3 | Daily SMA200 | 0.6206 |
The previous day high was 0.6242 while the previous day low was 0.6163. The daily 38.2% Fib levels comes at 0.6193, expected to provide resistance. Similarly, the daily 61.8% fib level is at 0.6212, expected to provide resistance.
Note the levels of interest below:
- Pivot support is noted at 0.614, 0.6112, 0.6061
- Pivot resistance is noted at 0.6219, 0.627, 0.6298
| Levels | Levels.1 |
|---|---|
| Previous Daily High | 0.6242 |
| Previous Daily Low | 0.6163 |
| Previous Weekly High | 0.6370 |
| Previous Weekly Low | 0.6163 |
| Previous Monthly High | 0.6250 |
| Previous Monthly Low | 0.5990 |
| Daily Fibonacci 38.2% | 0.6193 |
| Daily Fibonacci 61.8% | 0.6212 |
| Daily Pivot Point S1 | 0.6140 |
| Daily Pivot Point S2 | 0.6112 |
| Daily Pivot Point S3 | 0.6061 |
| Daily Pivot Point R1 | 0.6219 |
| Daily Pivot Point R2 | 0.6270 |
| Daily Pivot Point R3 | 0.6298 |
[/s2If]
Download Nehcap EAWe have two EAs that are operational on our LIVE accounts.
- EA-FIX: Check out the details here. Download EA-FIX . EA-FIX is a non-grid HFT scalper.
- EA-GROWTH: High quality low dd EA using trend grids. Download EA_GROWTHJoin Our Telegram Group
")


