The AUD/USD pair increased significantly on Thursday, breaking a four-day trend of continuous losses.
…
This is a premium post.
[s2If !current_user_can(access_s2member_level4)]Please register for FREE REGISTER to read full post below containing analysis. In case of any error or you think you are not able to read the full post below, please email us at support#nehcap.com [lwa][/s2If] [s2If current_user_can(access_s2member_level1)]
- AUD/USD gains strong positive traction on Thursday and snaps a four-day losing streak.
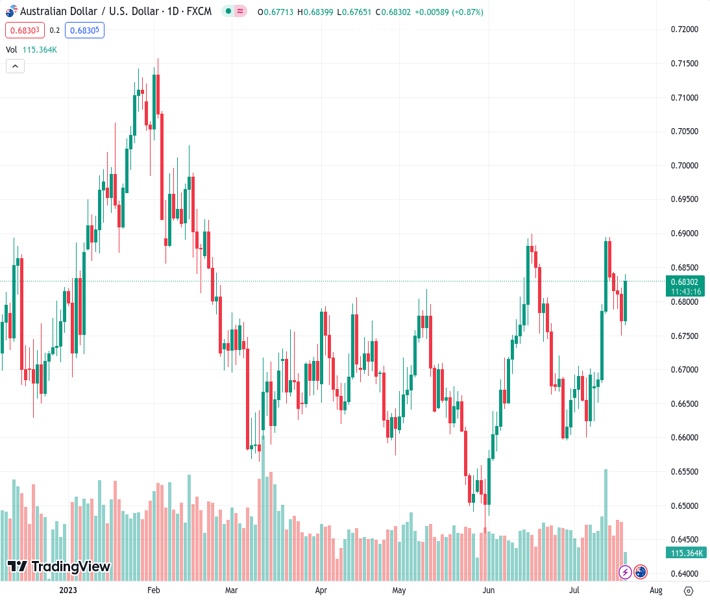
The pair currently trades last at 0.68301.
The previous day high was 0.682 while the previous day low was 0.675. The daily 38.2% Fib levels comes at 0.6777, expected to provide support. Similarly, the daily 61.8% fib level is at 0.6793, expected to provide support.
The AUD/USD pair catches aggressive bids on Thursday and sticks to its strong intraday gains through the early part of the European session. Spot prices currently trade around the 0.6825-0.6830 region, just a few pips below the daily peak, and for now, seem to have snapped a four-day losing streak to a one-week low touched on Wednesday.
The Australian Dollar (AUD) gets a lift following the release of the upbeat domestic employment figures, which pointed to a tight labour market and should put pressure on the the Reserve Bank of Australia (RBA) to hike interest rates again in August. Apart from this, the emergence of some US Dollae (USD) selling provides an additional boost to the AUD/USD pair and remains supportive of the intraday positive move.
The prospects for a less aggressive Federal Reserve (Fed) fail to assist the USD Index (DXY), which tracks the Greenback against a basket of currencies, to capitalize on its recent recovery from the lowest level since April 2022 touched on Tuesday. Investors seem convinced that the US central bank is nearing the end of its policy tightening and will hold rates steady for the rest of the year after the expected 25 bps lift-off in July.
Apart from this, the recent bullish run in the global equity markets turns out to be another factor undermining the safe-haven buck and benefitting the risk-sensitive Aussie. That said, concerns over slowing growth in China, the worsening US-China ties and geopolitical risks keep a lid on the optimism. Furthermore, skepticism that the Fed will commit to a more dovish policy stance helps limit losses for the Greenback.
This, in turn, is holding back traders from placing aggressive bullish bets around the AUD/USD pair, at least for the time being. Moreover, the recent repeated failures near the 0.6900 mark consitutes the formation of a bearish double-top on the daily chart and further warrants caution before positioning for any further appreciating move. Nevertheless, spot prices, for now, seem to have stalled the recent pullback from a one-month peak.
Market participants now look to the US economic docket – featuring the release of the usual Weekly Initial Jobless Claims, the Philly Fed Manufacturing Index and Existing Home Sales data. This, along with the broader risk sentiment, might influence the USD price dynamics and provide some imeptus to the AUD/USD pair.
Technical Levels: Supports and Resistances
AUDUSD currently trading at 0.6833 at the time of writing. Pair opened at 0.6772 and is trading with a change of 0.9 % .
| Overview | Overview.1 | |
|---|---|---|
| 0 | Today last price | 0.6833 |
| 1 | Today Daily Change | 0.0061 |
| 2 | Today Daily Change % | 0.9000 |
| 3 | Today daily open | 0.6772 |
The pair remains strongly bullish on the daily timeframe. It trades above its 20 SMA @ 0.6714, 50 SMA 0.6688, 100 SMA @ 0.6687 and 200 SMA @ 0.6713.
| Trends | Trends.1 | |
|---|---|---|
| 0 | Daily SMA20 | 0.6714 |
| 1 | Daily SMA50 | 0.6688 |
| 2 | Daily SMA100 | 0.6687 |
| 3 | Daily SMA200 | 0.6713 |
The previous day high was 0.682 while the previous day low was 0.675. The daily 38.2% Fib levels comes at 0.6777, expected to provide support. Similarly, the daily 61.8% fib level is at 0.6793, expected to provide support.
Note the levels of interest below:
- Pivot support is noted at 0.6741, 0.6711, 0.6671
- Pivot resistance is noted at 0.6811, 0.6851, 0.6881
| Levels | Levels.1 |
|---|---|
| Previous Daily High | 0.6820 |
| Previous Daily Low | 0.6750 |
| Previous Weekly High | 0.6895 |
| Previous Weekly Low | 0.6624 |
| Previous Monthly High | 0.6900 |
| Previous Monthly Low | 0.6484 |
| Daily Fibonacci 38.2% | 0.6777 |
| Daily Fibonacci 61.8% | 0.6793 |
| Daily Pivot Point S1 | 0.6741 |
| Daily Pivot Point S2 | 0.6711 |
| Daily Pivot Point S3 | 0.6671 |
| Daily Pivot Point R1 | 0.6811 |
| Daily Pivot Point R2 | 0.6851 |
| Daily Pivot Point R3 | 0.6881 |
[/s2If]
Download Nehcap EAWe have two EAs that are operational on our LIVE accounts.
- EA-FIX: Check out the details here. Download EA-FIX . EA-FIX is a non-grid HFT scalper.
- EA-GROWTH: High quality low dd EA using trend grids. Download EA_GROWTHJoin Our Telegram Group
")


