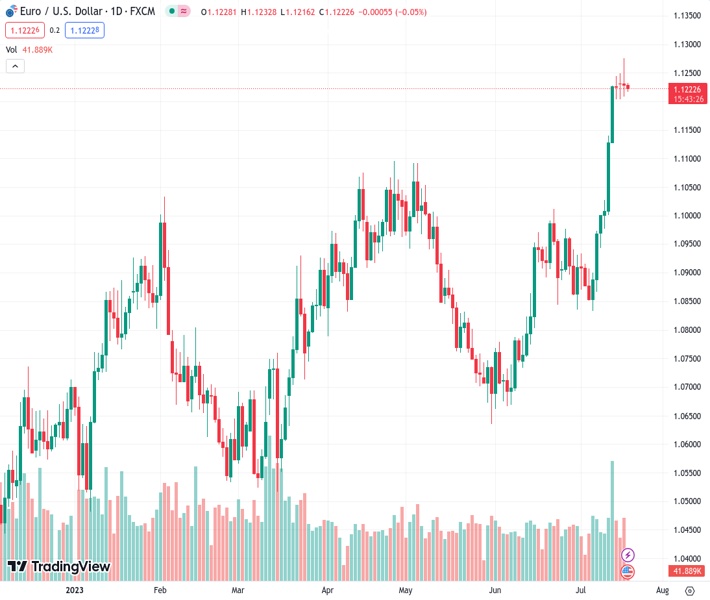
The EURUSD pair at the level of 1.12232 remains cautious and under pressure, following a downturn from its highest point in 17 months.
…
This is a premium post.
[s2If !current_user_can(access_s2member_level4)]Please register for FREE REGISTER to read full post below containing analysis. In case of any error or you think you are not able to read the full post below, please email us at support#nehcap.com [lwa][/s2If] [s2If current_user_can(access_s2member_level1)]
- EUR/USD stays defensive, mostly pressured, after reversing from 17-month high.
The pair currently trades last at 1.12232.
The previous day high was 1.1276 while the previous day low was 1.1209. The daily 38.2% Fib levels comes at 1.1234, expected to provide resistance. Similarly, the daily 61.8% fib level is at 1.125, expected to provide resistance.
EUR/USD stays on the back foot around 1.1220 heading into Wednesday’s European session, extending the previous day’s retreat from the highest level since February 2022. In doing so, the Euro pair not only justifies the US Dollar’s corrective bounce but also takes clues from the European Central Bank (ECB) concerns amid dicey market hours following a heavily optimistic performance.
Bloomberg came out with news suggesting that the ECB officials are struggling to determine the bloc’s central bank’s future moves. The news cites policymakers from across the spectrum while highlighting the difficulties in conveying the July rate hike. “The task will be to avoid strong signals of either another hike or a pause,” said the Bloomberg News citing anonymous policymakers.
On the other hand, the latest Reuters poll of around 109 economists suggests that the Fed’s widely anticipated 25 basis points (bps) rate hike in July will be the last increase of the current tightening cycle. Even so, Tuesday’s upbeat prints of the US Retail Sales Control Group for June underpin the chatters that the Fed will keep the rates higher for longer, if not lifting the rates further toward the north. The same views allow the US Dollar Index (DXY) to edge higher around 100.05, after bouncing off the 15-month low surrounding 99.55 the previous day.
It’s worth observing that mixed headlines surrounding China and optimism at the equity markets also tease the EUR/USD bears amid a sluggish session. China Industry Ministry recently conveyed fears of insufficient demand and declining revenues and justifies the downbeat Gross Domestic Product (GDP) data for the second quarter (Q2) that suggested fears of easing economic recovery in the world’s biggest industrial player. Considering China’s status as one of the biggest oil users, downbeat economic concerns about the dragon nation weigh on the commodity price.
On the other hand, the US banks expect more profits from the higher rates and push back recession woes, which in turn allow the sentiment to remain firmer and challenge the US Dollar bulls of late.
Against this backdrop, the S&P500 Futures grind near the highest levels since March 2022, dicey near 4,585 by the press time. Not only the US stock futures but the US 10-year and two-year Treasury bond yields also portray the sluggish markets as the benchmark US 10-year bond coupons remain pressured around 3.78% while the two-year counterpart edges lower to 4.75% at the latest.
With this, the EUR/USD is likely to extend the latest pullback amid a light calendar.
However, the final readings of the Eurozone inflation data for June and the US housing market indicators for the said month may entertain the Euro traders, along with the risk catalysts.
EUR/USD pullback remains elusive unless providing a daily close below the previous resistance line stretched from February 2023, at 1.1140 by the press time. Even so, the overbought RSI and multiple levels marked in early 2022 prod the Euro bulls around 1.1280.
Technical Levels: Supports and Resistances
EURUSD currently trading at 1.1224 at the time of writing. Pair opened at 1.1229 and is trading with a change of -0.04% % .
| Overview | Overview.1 | |
|---|---|---|
| 0 | Today last price | 1.1224 |
| 1 | Today Daily Change | -0.0005 |
| 2 | Today Daily Change % | -0.04% |
| 3 | Today daily open | 1.1229 |
The pair remains strongly bullish on the daily timeframe. It trades above its 20 SMA @ 1.0998, 50 SMA 1.0879, 100 SMA @ 1.0867 and 200 SMA @ 1.0668.
| Trends | Trends.1 | |
|---|---|---|
| 0 | Daily SMA20 | 1.0998 |
| 1 | Daily SMA50 | 1.0879 |
| 2 | Daily SMA100 | 1.0867 |
| 3 | Daily SMA200 | 1.0668 |
The previous day high was 1.1276 while the previous day low was 1.1209. The daily 38.2% Fib levels comes at 1.1234, expected to provide resistance. Similarly, the daily 61.8% fib level is at 1.125, expected to provide resistance.
Note the levels of interest below:
- Pivot support is noted at 1.12, 1.1171, 1.1133
- Pivot resistance is noted at 1.1267, 1.1305, 1.1333
| Levels | Levels.1 |
|---|---|
| Previous Daily High | 1.1276 |
| Previous Daily Low | 1.1209 |
| Previous Weekly High | 1.1245 |
| Previous Weekly Low | 1.0944 |
| Previous Monthly High | 1.1012 |
| Previous Monthly Low | 1.0662 |
| Daily Fibonacci 38.2% | 1.1234 |
| Daily Fibonacci 61.8% | 1.1250 |
| Daily Pivot Point S1 | 1.1200 |
| Daily Pivot Point S2 | 1.1171 |
| Daily Pivot Point S3 | 1.1133 |
| Daily Pivot Point R1 | 1.1267 |
| Daily Pivot Point R2 | 1.1305 |
| Daily Pivot Point R3 | 1.1333 |
[/s2If]
Download Nehcap EAWe have two EAs that are operational on our LIVE accounts.
- EA-FIX: Check out the details here. Download EA-FIX . EA-FIX is a non-grid HFT scalper.
- EA-GROWTH: High quality low dd EA using trend grids. Download EA_GROWTHJoin Our Telegram Group


