The USDJPY pair experiences a boost on Wednesday, moving higher towards its highest level of the week.
…
This is a premium post.
[s2If !current_user_can(access_s2member_level4)]Please register for FREE REGISTER to read full post below containing analysis. In case of any error or you think you are not able to read the full post below, please email us at support#nehcap.com [lwa][/s2If] [s2If current_user_can(access_s2member_level1)]
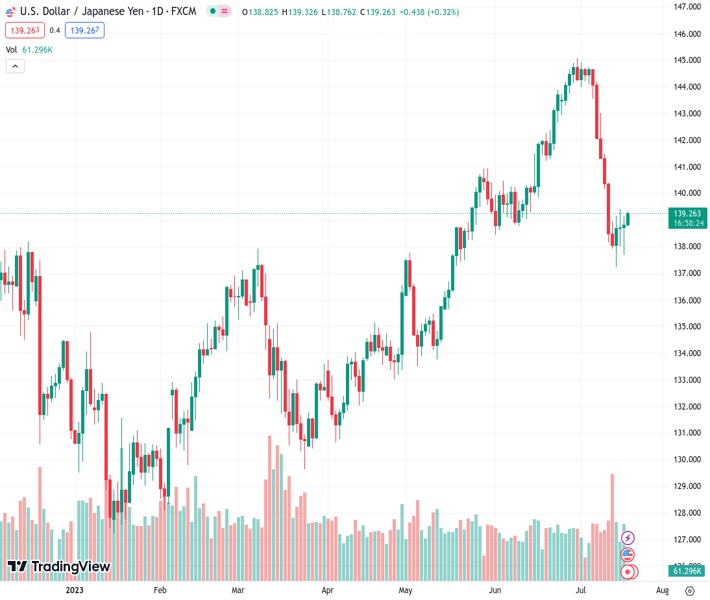
- USD/JPY gains some positive traction on Wednesday and climbs back closer to the weekly high.
The pair currently trades last at 139.244.
The previous day high was 139.14 while the previous day low was 137.68. The daily 38.2% Fib levels comes at 138.58, expected to provide support. Similarly, the daily 61.8% fib level is at 138.24, expected to provide support.
The USD/JPY pair edges higher on Wednesday and climbs back above the 139.00 mark during the Asian session, back closer to the top boundary of its weekly range. Spot prices currently trade around the 139.20 region, up over 0.25% for the day, though the technical setup remains tilted in favour of bearish traders and warrants caution before positioning for any meaningful upside in the near term.
The prevalent risk-on environment, along with less hawkish remarks by Bank of Japan (BOJ) Governor Kazuo Ueda, saying that there was still some distance to sustainably achieve the 2% inflation target, undermines the safe-haven Japanese Yen (JPY). Apart from this, a modest US Dollar (USD) uptick is seen as a key factor lending some support to the USD/JPY pair. That said, rising bets that the Federal Reserve (Fed) is nearing the end of its current rate-hiking cycle hold back the USD bulls from placing aggressive bets and act as a tailwind for the major.
From a technical perspective, the recent recovery from the vicinity of a confluence comprising technically significant Simple Moving Averages (100-day and 200-day SMAs) has been along an upward-sloping channel. Against the backdrop of the recent sharp retracement slide from levels just above the 145.00 mark, or the YTD peak touched in June, the said channel constitutes the formation of a bearish flag pattern. Furthermore, oscillators on the daily chart are holding deep in the negative territory and validate the negative outlook for the USD/JPY pair.
Hence, any subsequent move up is more likely to confront stiff resistance near the top boundary of the aforementioned trend channel, currently around the 139.70 region. This is closely followed by the 200-hour SMA, just ahead of the 140.00 psychological mark, which if cleared decisively will negate the bearish setup and prompt aggressive short-covering move. The USD/JPY pair might then accelerate the recovery momentum towards the 140.45-140.50 intermediate hurdle en route to the 141.00 round figure and the 141.25-141.300 supply zone.
On the flip side, sustained weakness back below the 139.00 mark now seems to attract some buyers near the 138.40-138.35 region ahead of the 138.00 mark, which coincides with the trend-channel support. Some follow-through selling below the weekly low, around the 137.70-137.65 region touched on Tuesday, will confirm the bearish flag breakdown and expose the 100-day/200-day SMAs confluence, near the 137.00 level. Spot prices might then turn vulnerable to prolonging the recent downward trajectory witnessed over the past two weeks or so.
Technical Levels: Supports and Resistances
USDJPY currently trading at 139.16 at the time of writing. Pair opened at 138.84 and is trading with a change of 0.23 % .
| Overview | Overview.1 | |
|---|---|---|
| 0 | Today last price | 139.16 |
| 1 | Today Daily Change | 0.32 |
| 2 | Today Daily Change % | 0.23 |
| 3 | Today daily open | 138.84 |
The pair is trading below its 20 Daily moving average @ 142.22, below its 50 Daily moving average @ 140.29 , above its 100 Daily moving average @ 137.07 and above its 200 Daily moving average @ 137.02
| Trends | Trends.1 | |
|---|---|---|
| 0 | Daily SMA20 | 142.22 |
| 1 | Daily SMA50 | 140.29 |
| 2 | Daily SMA100 | 137.07 |
| 3 | Daily SMA200 | 137.02 |
The previous day high was 139.14 while the previous day low was 137.68. The daily 38.2% Fib levels comes at 138.58, expected to provide support. Similarly, the daily 61.8% fib level is at 138.24, expected to provide support.
Note the levels of interest below:
- Pivot support is noted at 137.97, 137.1, 136.52
- Pivot resistance is noted at 139.42, 140.0, 140.87
| Levels | Levels.1 |
|---|---|
| Previous Daily High | 139.14 |
| Previous Daily Low | 137.68 |
| Previous Weekly High | 143.00 |
| Previous Weekly Low | 137.24 |
| Previous Monthly High | 145.07 |
| Previous Monthly Low | 138.43 |
| Daily Fibonacci 38.2% | 138.58 |
| Daily Fibonacci 61.8% | 138.24 |
| Daily Pivot Point S1 | 137.97 |
| Daily Pivot Point S2 | 137.10 |
| Daily Pivot Point S3 | 136.52 |
| Daily Pivot Point R1 | 139.42 |
| Daily Pivot Point R2 | 140.00 |
| Daily Pivot Point R3 | 140.87 |
[/s2If]
Download Nehcap EAWe have two EAs that are operational on our LIVE accounts.
- EA-FIX: Check out the details here. Download EA-FIX . EA-FIX is a non-grid HFT scalper.
- EA-GROWTH: High quality low dd EA using trend grids. Download EA_GROWTHJoin Our Telegram Group


