The USDCHF currency pair is finding it difficult to make any significant rebound from the lowest level reached in several years on Tuesday.
…
This is a premium post.
[s2If !current_user_can(access_s2member_level4)]Please register for FREE REGISTER to read full post below containing analysis. In case of any error or you think you are not able to read the full post below, please email us at support#nehcap.com [lwa][/s2If] [s2If current_user_can(access_s2member_level1)]
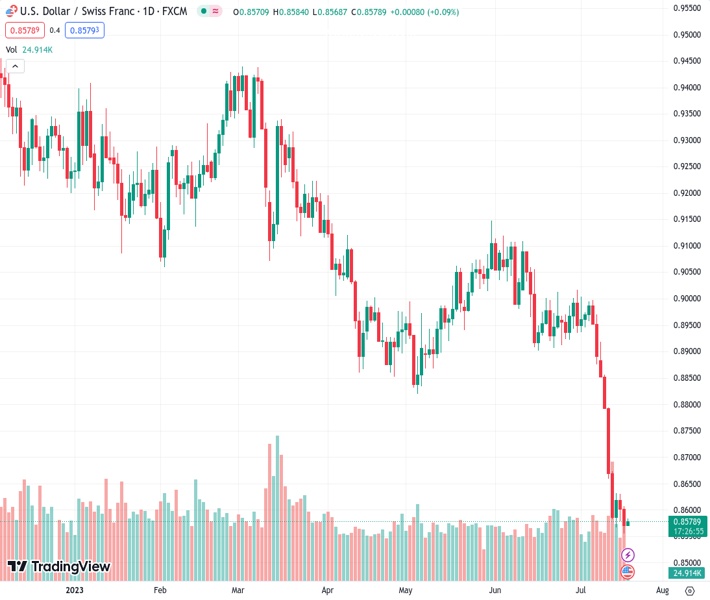
- USD/CHF struggles to register any meaningful recovery from a multi-year low set on Tuesday.
The pair currently trades last at 0.85784.
The previous day high was 0.8608 while the previous day low was 0.8555. The daily 38.2% Fib levels comes at 0.8575, expected to provide support. Similarly, the daily 61.8% fib level is at 0.8588, expected to provide resistance.
The USD/CHF pair oscillates in a narrow trading band, around the 0.8575-0.8580 region through the Asian session on Wednesday and consolidates its recent downfall to the lowest level since January 2015 touched the previous day.
The prevailing risk-on environment is seen undermining demand for the safe-haven Swiss Franc (CHF) and turning out to be a key factor lending some support to the USD/CHF pair. The weaker economic data from China this week fueled speculations about the possibility of more stimulus measures from the government. This, to some extent, helps ease concerns over slowing economic growth in China and boosts investors’ confidence, which led to the recent rally across the global equity markets.
That said, the underlying bearish sentiment surrounding the US Dollar (USD) fails to assist the USD/CHF pair to attract any meaningful buying and acts as a headwind. In fact, the USD Index (DXY), which tracks the Greenback against a basket of currencies, remains well within the striking distance of its lowest level since April 2022 touched on Tuesday. Investors seem convinced that the Federal Reserve (Fed) will soften its hawkish stance and keep rates steady after the expected 25 bps lift-off in July.
The bets were lifted by the US CPI report, which pointed to a further moderation in consumer prices. Furthermore, data released on Tuesday showed that the headline US Retail Sales rose less than expected in June and Industrial Production surprisingly fell in June. This reaffirmed market expectations that the Fed may be close to reaching the end of its current policy-tightening cycle, which has been a key factor behind the recent slide in the US Treasury bond yields and continues to weigh on the USD.
However, the resilient core US Retail Sales – excluding automobiles, gasoline, building materials and food services – raised doubts if the Fed will commit to a more dovish policy stance or stick to its forecast for a 50 bps rate hike this year. This, in turn, is holding back traders from placing fresh bearish bets around the USD, which, along with the oversold technical indicators on the daily chart, supports prospects for some near-term consolidation for the USD/CHF pair or a modest corrective bounce.
Market participants now look forward to the US housing market data – Building Permits and Housing Starts – for some impetus later during the early North American session. Apart from this, the US bond yields will drive the USD demand. This, along with the broader risk sentiment, should contribute to producing short-term trading opportunities around the USD/CHF pair. Nevertheless, the aforementioned fundamental backdrop suggests that the path of least resistance for spot prices is to the downside.
Technical Levels: Supports and Resistances
USDCHF currently trading at 0.8579 at the time of writing. Pair opened at 0.8575 and is trading with a change of 0.05 % .
| Overview | Overview.1 | |
|---|---|---|
| 0 | Today last price | 0.8579 |
| 1 | Today Daily Change | 0.0004 |
| 2 | Today Daily Change % | 0.0500 |
| 3 | Today daily open | 0.8575 |
The pair remains strongly bearish on the daily time frame. It trades below the 20 SMA @ 0.8857, 50 SMA 0.8953, 100 SMA @ 0.9025 and 200 SMA @ 0.9239.
| Trends | Trends.1 | |
|---|---|---|
| 0 | Daily SMA20 | 0.8857 |
| 1 | Daily SMA50 | 0.8953 |
| 2 | Daily SMA100 | 0.9025 |
| 3 | Daily SMA200 | 0.9239 |
The previous day high was 0.8608 while the previous day low was 0.8555. The daily 38.2% Fib levels comes at 0.8575, expected to provide support. Similarly, the daily 61.8% fib level is at 0.8588, expected to provide resistance.
Note the levels of interest below:
- Pivot support is noted at 0.8551, 0.8527, 0.8499
- Pivot resistance is noted at 0.8604, 0.8632, 0.8656
| Levels | Levels.1 |
|---|---|
| Previous Daily High | 0.8608 |
| Previous Daily Low | 0.8555 |
| Previous Weekly High | 0.8918 |
| Previous Weekly Low | 0.8566 |
| Previous Monthly High | 0.9120 |
| Previous Monthly Low | 0.8902 |
| Daily Fibonacci 38.2% | 0.8575 |
| Daily Fibonacci 61.8% | 0.8588 |
| Daily Pivot Point S1 | 0.8551 |
| Daily Pivot Point S2 | 0.8527 |
| Daily Pivot Point S3 | 0.8499 |
| Daily Pivot Point R1 | 0.8604 |
| Daily Pivot Point R2 | 0.8632 |
| Daily Pivot Point R3 | 0.8656 |
[/s2If]
Download Nehcap EAWe have two EAs that are operational on our LIVE accounts.
- EA-FIX: Check out the details here. Download EA-FIX . EA-FIX is a non-grid HFT scalper.
- EA-GROWTH: High quality low dd EA using trend grids. Download EA_GROWTHJoin Our Telegram Group


