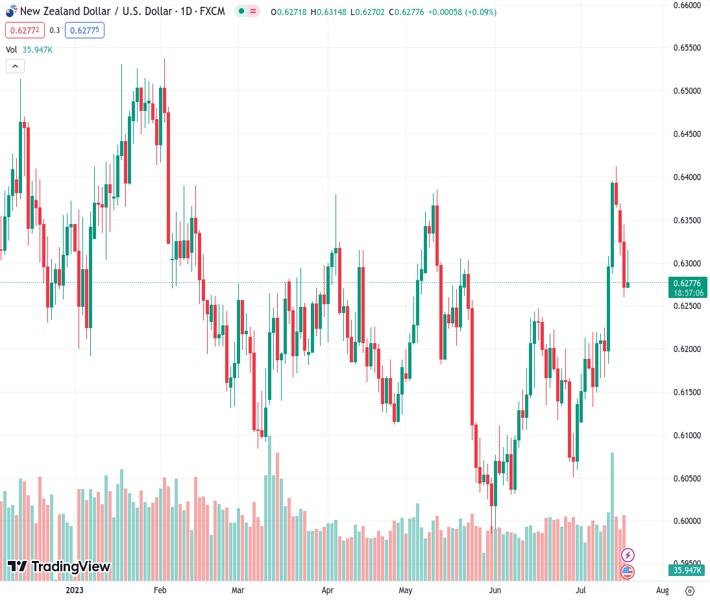
After a rise in New Zealand’s inflation rate, the NZD/USD currency pair is trading at a level of 0.62837 and experiencing a consolidation period. This is due to the mixed sentiment in the market and the US Dollar’s corrective rebound.
…
This is a premium post.
[s2If !current_user_can(access_s2member_level4)]Please register for FREE REGISTER to read full post below containing analysis. In case of any error or you think you are not able to read the full post below, please email us at support#nehcap.com [lwa][/s2If] [s2If current_user_can(access_s2member_level1)]
- NZD/USD consolidates post-NZ inflation gains amid mixed sentiment, US Dollar’s corrective bounce.
The pair currently trades last at 0.62837.
The previous day high was 0.6345 while the previous day low was 0.6259. The daily 38.2% Fib levels comes at 0.6292, expected to provide resistance. Similarly, the daily 61.8% fib level is at 0.6312, expected to provide resistance.
NZD/USD trims the first daily gains in four around 0.6285 amid Wednesday’s mid-Asian session, following a quick run-up to 0.6334 marked earlier in the day.
That said, the Kiwi pair’s latest weakness could be linked to the US Dollar’s ability to defend the previous day’s corrective bounce off the multi-month low, as well as sluggish markets. However, the better-than-forecast inflation data from New Zealand (NZ) put a floor under the Kiwi pair.
New Zealand’s (NZ) headline inflation, per the Consumer Price Index (CPI), edges lower to 1.1% QoQ and 6.0% YoY for the second quarter (Q2) of 2023 versus 1.2% and 6.7% respective priors. In doing so, the NZ data justifies the market’s cautious mood about the Reserve Bank of New Zealand’s (RBNZ) pause in the rate hike trajectory marked the last week.
It’s worth noting that the welcome details of the US Core Retail Sales for June underpinned the DXY’s recovery from the lowest level since April 2022. However, the risk-on mood and chatters about the US Federal Reserve’s (Fed) policy pivot prod the US Dollar bulls amid an absence of major data/events, which in turn weigh on the NZD/USD price.
The risk appetite improves on the positive performance of the US banks, as well as the risk-positive headlines surrounding China, which in turn allowed the Wall Street benchmarks to refresh the yearly top. The same joins the latest Reuters poll of around 109 economists suggesting that the Fed’s widely anticipated 25 basis points (bps) rate hike in July will be the last increase of the current tightening cycle, to propel the NZD/USD price.
In the case of the US data, the Retail Sales growth for June came in as 0.2% MoM versus 0.5% expected and prior (revised). However, the Retail Sales Control Group marked 0.6% growth versus market forecasts of -0.3% and 0.3% previous readings. It should be noted that the US Industrial Production reprinted -0.5% for June compared to analysts’ estimations of 0.0%.
Amid these plays, the US Dollar Index (DXY) edges higher around 100.00, after bouncing off 99.56 the previous day, whereas the S&P500 Futures and yields appear indecisive at the latest.
Given the lack of major data/events, as well as headlines suggesting China’s Foreign Minister’s defense of geopolitical bias toward the US, the NZD/USD pair traders should keep their eyes on the risk catalysts for clear directions.
A three-week-old ascending trend line joins 10-DMA to highlight 0.6270 as a short-term key support confluence for the NZD/USD bears to watch.
Technical Levels: Supports and Resistances
NZDUSD currently trading at 0.6286 at the time of writing. Pair opened at 0.6273 and is trading with a change of 0.21% % .
| Overview | Overview.1 | |
|---|---|---|
| 0 | Today last price | 0.6286 |
| 1 | Today Daily Change | 0.0013 |
| 2 | Today Daily Change % | 0.21% |
| 3 | Today daily open | 0.6273 |
The pair remains strongly bullish on the daily timeframe. It trades above its 20 SMA @ 0.6201, 50 SMA 0.6174, 100 SMA @ 0.6195 and 200 SMA @ 0.6197.
| Trends | Trends.1 | |
|---|---|---|
| 0 | Daily SMA20 | 0.6201 |
| 1 | Daily SMA50 | 0.6174 |
| 2 | Daily SMA100 | 0.6195 |
| 3 | Daily SMA200 | 0.6197 |
The previous day high was 0.6345 while the previous day low was 0.6259. The daily 38.2% Fib levels comes at 0.6292, expected to provide resistance. Similarly, the daily 61.8% fib level is at 0.6312, expected to provide resistance.
Note the levels of interest below:
- Pivot support is noted at 0.624, 0.6206, 0.6154
- Pivot resistance is noted at 0.6326, 0.6378, 0.6412
| Levels | Levels.1 |
|---|---|
| Previous Daily High | 0.6345 |
| Previous Daily Low | 0.6259 |
| Previous Weekly High | 0.6413 |
| Previous Weekly Low | 0.6166 |
| Previous Monthly High | 0.6250 |
| Previous Monthly Low | 0.5990 |
| Daily Fibonacci 38.2% | 0.6292 |
| Daily Fibonacci 61.8% | 0.6312 |
| Daily Pivot Point S1 | 0.6240 |
| Daily Pivot Point S2 | 0.6206 |
| Daily Pivot Point S3 | 0.6154 |
| Daily Pivot Point R1 | 0.6326 |
| Daily Pivot Point R2 | 0.6378 |
| Daily Pivot Point R3 | 0.6412 |
[/s2If]
Download Nehcap EAWe have two EAs that are operational on our LIVE accounts.
- EA-FIX: Check out the details here. Download EA-FIX . EA-FIX is a non-grid HFT scalper.
- EA-GROWTH: High quality low dd EA using trend grids. Download EA_GROWTHJoin Our Telegram Group


