The GBPJPY currency pair has stopped its downward movement and suggests a tendency to move upwards due to the formation of a bullish-harami pattern consisting of two candlesticks.
…
This is a premium post.
[s2If !current_user_can(access_s2member_level4)]Please register for FREE REGISTER to read full post below containing analysis. In case of any error or you think you are not able to read the full post below, please email us at support#nehcap.com [lwa][/s2If] [s2If current_user_can(access_s2member_level1)]
- GBP/JPY halts its slide, hinting at an upward bias with a bullish-harami two-candlestick pattern.
The pair currently trades last at 180.968.
The previous day high was 182.15 while the previous day low was 180.58. The daily 38.2% Fib levels comes at 181.18, expected to provide resistance. Similarly, the daily 61.8% fib level is at 181.55, expected to provide resistance.
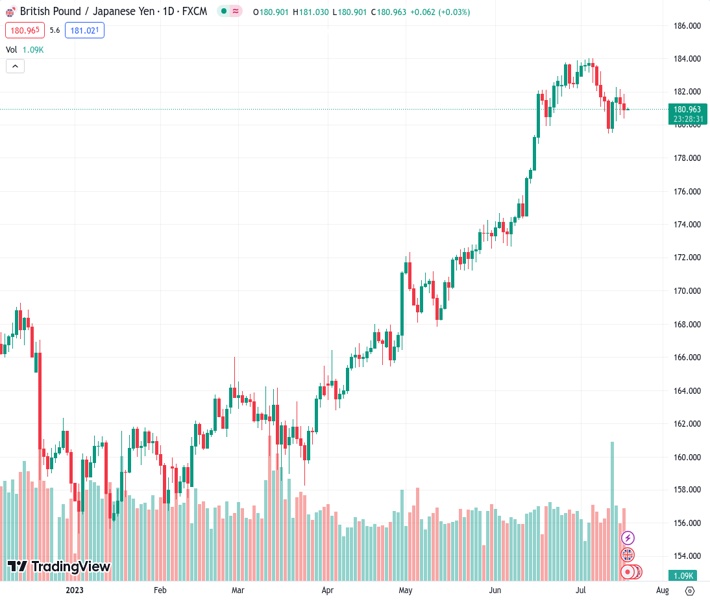
GBP/JPY registers minimal gains as the Asian session begins, of 0.04% after Tuesday’s session witnessed Pound Sterling (GBP) weakness during most of the day. However, dovish comments from the Bank of Japan (BoJ) Governor Kazuo Ueda weighed on the Japanese Yen (JPY). At the time of writing, the GBP/JPY exchanges hands at 180.99.
The daily chart portrays the cross as upward biased after stopping its slide on July 13 as a bullish-harami two candlestick pattern, suggesting prices would increase. Nevertheless, subsequent pin-bar candles and two negative sessions weighed on the GBP/JPY, slumping from around 182.19, just below the 181.00 figure.
For a bearish continuation, the GBP/JPY must surpass the July 17 low of 180.36, followed by the Kijun-Sen at 180.23. Once cleared, GBP/JPY must test 180.00, aiming toward lower price levels. Contrarily, for the GBP/JPY to resumeits uptrend, the first resistance would be the Tenkan-Sen at 181.52. Once that level hurdled, GBP/JPY would test June 30 daily low turned resistance at 182.20, followed by the year-to-date (YTD) high at 183.90.
Technical Levels: Supports and Resistances
GBPJPY currently trading at 181.06 at the time of writing. Pair opened at 181.35 and is trading with a change of -0.16 % .
| Overview | Overview.1 | |
|---|---|---|
| 0 | Today last price | 181.06 |
| 1 | Today Daily Change | -0.29 |
| 2 | Today Daily Change % | -0.16 |
| 3 | Today daily open | 181.35 |
The pair is trading below its 20 Daily moving average @ 182.31, above its 50 Daily moving average @ 177.09 , above its 100 Daily moving average @ 170.95 and above its 200 Daily moving average @ 167.28
| Trends | Trends.1 | |
|---|---|---|
| 0 | Daily SMA20 | 182.31 |
| 1 | Daily SMA50 | 177.09 |
| 2 | Daily SMA100 | 170.95 |
| 3 | Daily SMA200 | 167.28 |
The previous day high was 182.15 while the previous day low was 180.58. The daily 38.2% Fib levels comes at 181.18, expected to provide resistance. Similarly, the daily 61.8% fib level is at 181.55, expected to provide resistance.
Note the levels of interest below:
- Pivot support is noted at 180.57, 179.79, 178.99
- Pivot resistance is noted at 182.14, 182.93, 183.71
| Levels | Levels.1 |
|---|---|
| Previous Daily High | 182.15 |
| Previous Daily Low | 180.58 |
| Previous Weekly High | 183.23 |
| Previous Weekly Low | 179.47 |
| Previous Monthly High | 183.88 |
| Previous Monthly Low | 172.67 |
| Daily Fibonacci 38.2% | 181.18 |
| Daily Fibonacci 61.8% | 181.55 |
| Daily Pivot Point S1 | 180.57 |
| Daily Pivot Point S2 | 179.79 |
| Daily Pivot Point S3 | 178.99 |
| Daily Pivot Point R1 | 182.14 |
| Daily Pivot Point R2 | 182.93 |
| Daily Pivot Point R3 | 183.71 |
[/s2If]
Download Nehcap EAWe have two EAs that are operational on our LIVE accounts.
- EA-FIX: Check out the details here. Download EA-FIX . EA-FIX is a non-grid HFT scalper.
- EA-GROWTH: High quality low dd EA using trend grids. Download EA_GROWTHJoin Our Telegram Group


