The USDJPY currency pair has found stability at a level of 138.983, with assistance from the Ichimoku Cloud and the 100-day Exponential Moving Average.
…
This is a premium post.
[s2If !current_user_can(access_s2member_level4)]Please register for FREE REGISTER to read full post below containing analysis. In case of any error or you think you are not able to read the full post below, please email us at support#nehcap.com [lwa][/s2If] [s2If current_user_can(access_s2member_level1)]
- USD/JPY stabilized, aided by Ichimoku Cloud and 100-day EMA.
The pair currently trades last at 138.983.
The previous day high was 139.41 while the previous day low was 138.0. The daily 38.2% Fib levels comes at 138.54, expected to provide support. Similarly, the daily 61.8% fib level is at 138.87, expected to provide support.
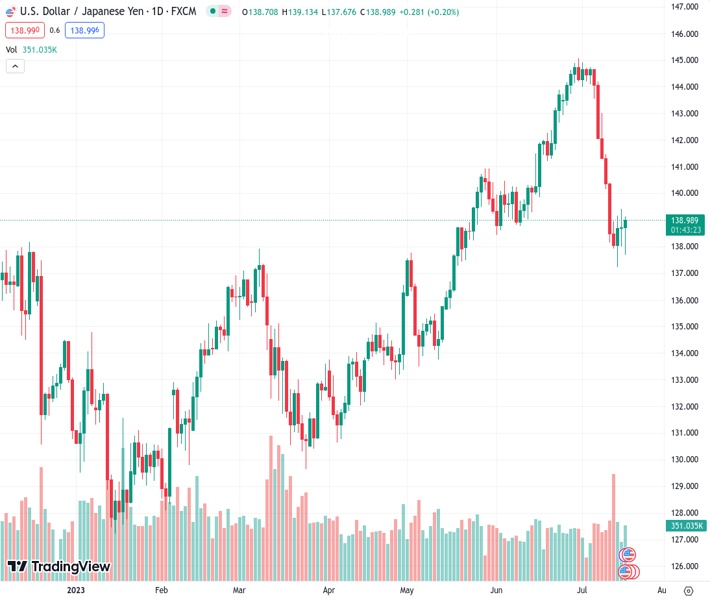
USD/JPY seesaws around the top/bottom of the 138.00 figure as the Ichimoku Cloud (Kumo) cushions the USD/JPY’s pair fall. That, alongside the 100-day Exponential Moving Average (EMA) at 138.31, maintains the USD/JPY afloat, which trades at around 138.83 after hitting a daily low of 137.67.
The USD/JPY daily chart portrays the pair making a base after reaching a month-and-a-half low of 137.23 on July 14. Since then, the USD/JPY has not fallen below 137.50, but price action shows neither buyers nor sellers are in control. Nevertheless, if USD/JPY buyers would like to push prices higher, they will need to reclaim the 50-day Exponential Moving Average (EMA) at 139.99 before challenging the confluence of the 20 and 200-day EMAs at the 140.89/95 range.
For a bearish continuation, USD/JPY sellers would need to crack 138.00, followed by the current month’s low of 137.24, before slumping to the 137.00 psychological figure. Once cleared, the USD/JPY next support emerges at the 200-day EMA 136.47.
Technical Levels: Supports and Resistances
USDJPY currently trading at 138.82 at the time of writing. Pair opened at 138.72 and is trading with a change of 0.07 % .
| Overview | Overview.1 | |
|---|---|---|
| 0 | Today last price | 138.82 |
| 1 | Today Daily Change | 0.10 |
| 2 | Today Daily Change % | 0.07 |
| 3 | Today daily open | 138.72 |
The pair is trading below its 20 Daily moving average @ 142.35, below its 50 Daily moving average @ 140.22 , above its 100 Daily moving average @ 137.04 and above its 200 Daily moving average @ 137.05
| Trends | Trends.1 | |
|---|---|---|
| 0 | Daily SMA20 | 142.35 |
| 1 | Daily SMA50 | 140.22 |
| 2 | Daily SMA100 | 137.04 |
| 3 | Daily SMA200 | 137.05 |
The previous day high was 139.41 while the previous day low was 138.0. The daily 38.2% Fib levels comes at 138.54, expected to provide support. Similarly, the daily 61.8% fib level is at 138.87, expected to provide support.
Note the levels of interest below:
- Pivot support is noted at 138.0, 137.29, 136.59
- Pivot resistance is noted at 139.42, 140.12, 140.83
| Levels | Levels.1 |
|---|---|
| Previous Daily High | 139.41 |
| Previous Daily Low | 138.00 |
| Previous Weekly High | 143.00 |
| Previous Weekly Low | 137.24 |
| Previous Monthly High | 145.07 |
| Previous Monthly Low | 138.43 |
| Daily Fibonacci 38.2% | 138.54 |
| Daily Fibonacci 61.8% | 138.87 |
| Daily Pivot Point S1 | 138.00 |
| Daily Pivot Point S2 | 137.29 |
| Daily Pivot Point S3 | 136.59 |
| Daily Pivot Point R1 | 139.42 |
| Daily Pivot Point R2 | 140.12 |
| Daily Pivot Point R3 | 140.83 |
[/s2If]
Download Nehcap EAWe have two EAs that are operational on our LIVE accounts.
- EA-FIX: Check out the details here. Download EA-FIX . EA-FIX is a non-grid HFT scalper.
- EA-GROWTH: High quality low dd EA using trend grids. Download EA_GROWTHJoin Our Telegram Group


