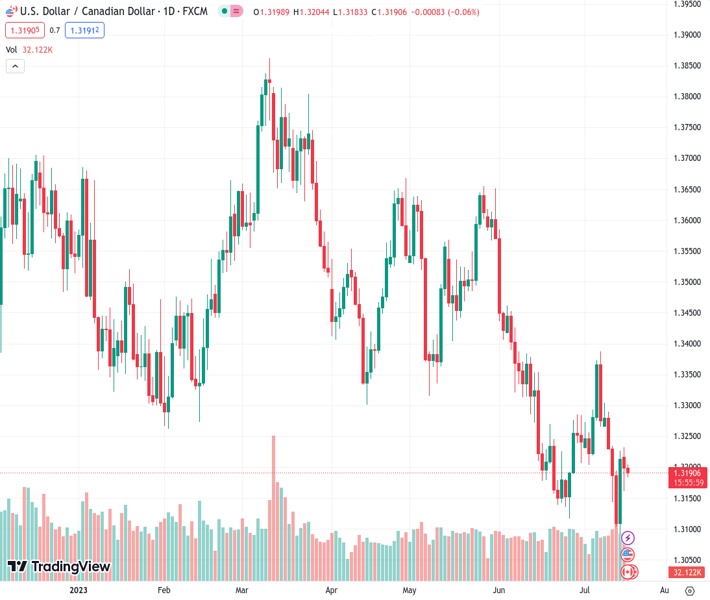
The USDCAD currency pair, currently at 1.31907, is experiencing a loss of momentum as it approaches the 1.3180 level during the Asian trading session.
…
This is a premium post.
[s2If !current_user_can(access_s2member_level4)]Please register for FREE REGISTER to read full post below containing analysis. In case of any error or you think you are not able to read the full post below, please email us at support#nehcap.com [lwa][/s2If] [s2If current_user_can(access_s2member_level1)]
- USD/CAD loses the momentum near 1.3180 in the Asian session.
The pair currently trades last at 1.31907.
The previous day high was 1.3232 while the previous day low was 1.3161. The daily 38.2% Fib levels comes at 1.3188, expected to provide support. Similarly, the daily 61.8% fib level is at 1.3205, expected to provide resistance.
The USD/CAD pair struggles to gain traction on Tuesday, backed by the prevailing US Dollar selling bias. The major pair currently trades around 1.3185, down 0.09% on the day.
The Federal Reserve Bank of New York reported Monday that the NY Empire State Manufacturing Index dropped from -5.5 to 1.1, above expectations of -3.5. The US Dollar remains under pressure amid cautious optimism, and markets anticipate the Federal Reserve (Fed) to be less hawkish in tightening monetary policy following an expected interest rate hike in the July 26 meeting. This, in turn, leads to the recent decline in the US Treasury bond yields and keeps the USD bulls on the defensive.
That being said, crude oil reverses its pullback on Monday and boosts the commodity-linked Loonie. Additionally, the broader risk sentiment might influence the USD demand and provide some impetus to the USD/CAD pair in the following sessions.
Looking ahead, market participants will keep an eye on the Canadian Consumer Price Index (CPI) MoM and the US Retail Sales later in the day. The Fed has entered its blackout period ahead of the July 25-26 meeting. Investors will digest the data and find a clear direction for the USD/CAD pair.
Technical Levels: Supports and Resistances
USDCAD currently trading at 1.3186 at the time of writing. Pair opened at 1.3199 and is trading with a change of -0.1 % .
| Overview | Overview.1 | |
|---|---|---|
| 0 | Today last price | 1.3186 |
| 1 | Today Daily Change | -0.0013 |
| 2 | Today Daily Change % | -0.1000 |
| 3 | Today daily open | 1.3199 |
The pair remains strongly bearish on the daily time frame. It trades below the 20 SMA @ 1.3223, 50 SMA 1.3355, 100 SMA @ 1.3468 and 200 SMA @ 1.3489.
| Trends | Trends.1 | |
|---|---|---|
| 0 | Daily SMA20 | 1.3223 |
| 1 | Daily SMA50 | 1.3355 |
| 2 | Daily SMA100 | 1.3468 |
| 3 | Daily SMA200 | 1.3489 |
The previous day high was 1.3232 while the previous day low was 1.3161. The daily 38.2% Fib levels comes at 1.3188, expected to provide support. Similarly, the daily 61.8% fib level is at 1.3205, expected to provide resistance.
Note the levels of interest below:
- Pivot support is noted at 1.3163, 1.3126, 1.3091
- Pivot resistance is noted at 1.3234, 1.3269, 1.3305
| Levels | Levels.1 |
|---|---|
| Previous Daily High | 1.3232 |
| Previous Daily Low | 1.3161 |
| Previous Weekly High | 1.3304 |
| Previous Weekly Low | 1.3093 |
| Previous Monthly High | 1.3585 |
| Previous Monthly Low | 1.3117 |
| Daily Fibonacci 38.2% | 1.3188 |
| Daily Fibonacci 61.8% | 1.3205 |
| Daily Pivot Point S1 | 1.3163 |
| Daily Pivot Point S2 | 1.3126 |
| Daily Pivot Point S3 | 1.3091 |
| Daily Pivot Point R1 | 1.3234 |
| Daily Pivot Point R2 | 1.3269 |
| Daily Pivot Point R3 | 1.3305 |
[/s2If]
Download Nehcap EAWe have two EAs that are operational on our LIVE accounts.
- EA-FIX: Check out the details here. Download EA-FIX . EA-FIX is a non-grid HFT scalper.
- EA-GROWTH: High quality low dd EA using trend grids. Download EA_GROWTHJoin Our Telegram Group


